Leakage Current Monitor
Author: J. Thorne
Leakage current monitor
Documents for the leakage current monitor:
File:Advanced electrical design models.pdf
File:Littelfuse tvs diode 5kp datasheet.pdf.pdf
File:Metal oxide resistors special purpose high voltage.pdf
File:Mcc-usb-1608fs-plus-manual.pdf
File:Meilhaus-me-usb isolator.pdf
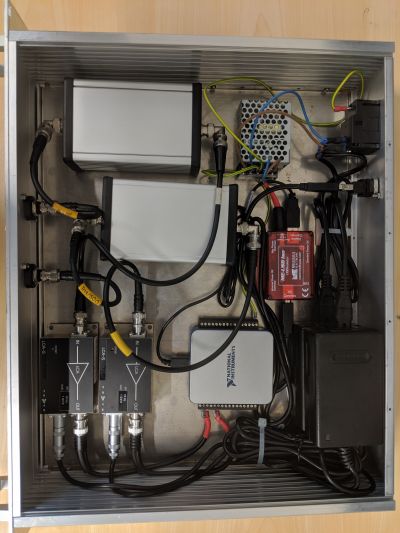
Picture of the inside of the box
The device has two isolated BNC channels. These cables go to the diode protection box. This consists of 5 rows of paired uni-directional 5KP 12A TVS diodes soldered in the backward direction to each other. This provides a sharp threshold voltage in which current will pass over them. In the forward direction the slope of current against voltage is an exponential, allowing large leakage current over them and producing noise.
In order to further add protection and reduce noise on the signal, a 1 GOhm high voltage resistor, rated to 25 kV, is added before leading to the Femto LCA-S device. This device converts the +/-10 nA input to +/-10 V output. This has a gain of 1 GV/A with a 10 Hz bandwidth. This device has an offset which can be adjusted to zeroth the signal. Possibly over time this has to be adjusted again as the device has some form of drift. The two Femto LCA-S is powered by custom power supplies. CAUTION these can get hot!
After the Femto device, the +/-10 V output is converted to a digital signal via the MCC DAQ. This device can have multiple inputs with up to 100 kS/s. In order to protect the PC due to any residual discharges, the MCC DAQ is optically isolated via the Meilhaus ME USB Isolator. The isolator is powered by a mains to 5V output converter.
The box has three separate ground paths which are isolated to one another. Each channel has a dedicated ground path from the BNC connector through diode protection box, Femto LCA-S device, to the MCC DAQ as the reference ground. The box is grounded via the mains with each device inside kept separate from this ground. The reason for this is that the discharge will return through the BNC cables to the grounding on the vacuum tank. The LCM is designed to attach BNC cables from this device to a vacuum feed through connected to the isolated electrodes. This feed through creates the grounding connection.
Characterisation
In order to understand how the device behaves, measurements were taken using the constant low current Keysight B2900A power supply. This can deliver current down to +/-100 pA. The data from the MCC DAQ records data in a buffer then calculates the mean and standard deviation for given sample rate.
Measurement of the crosstalk between channel 1 and 2
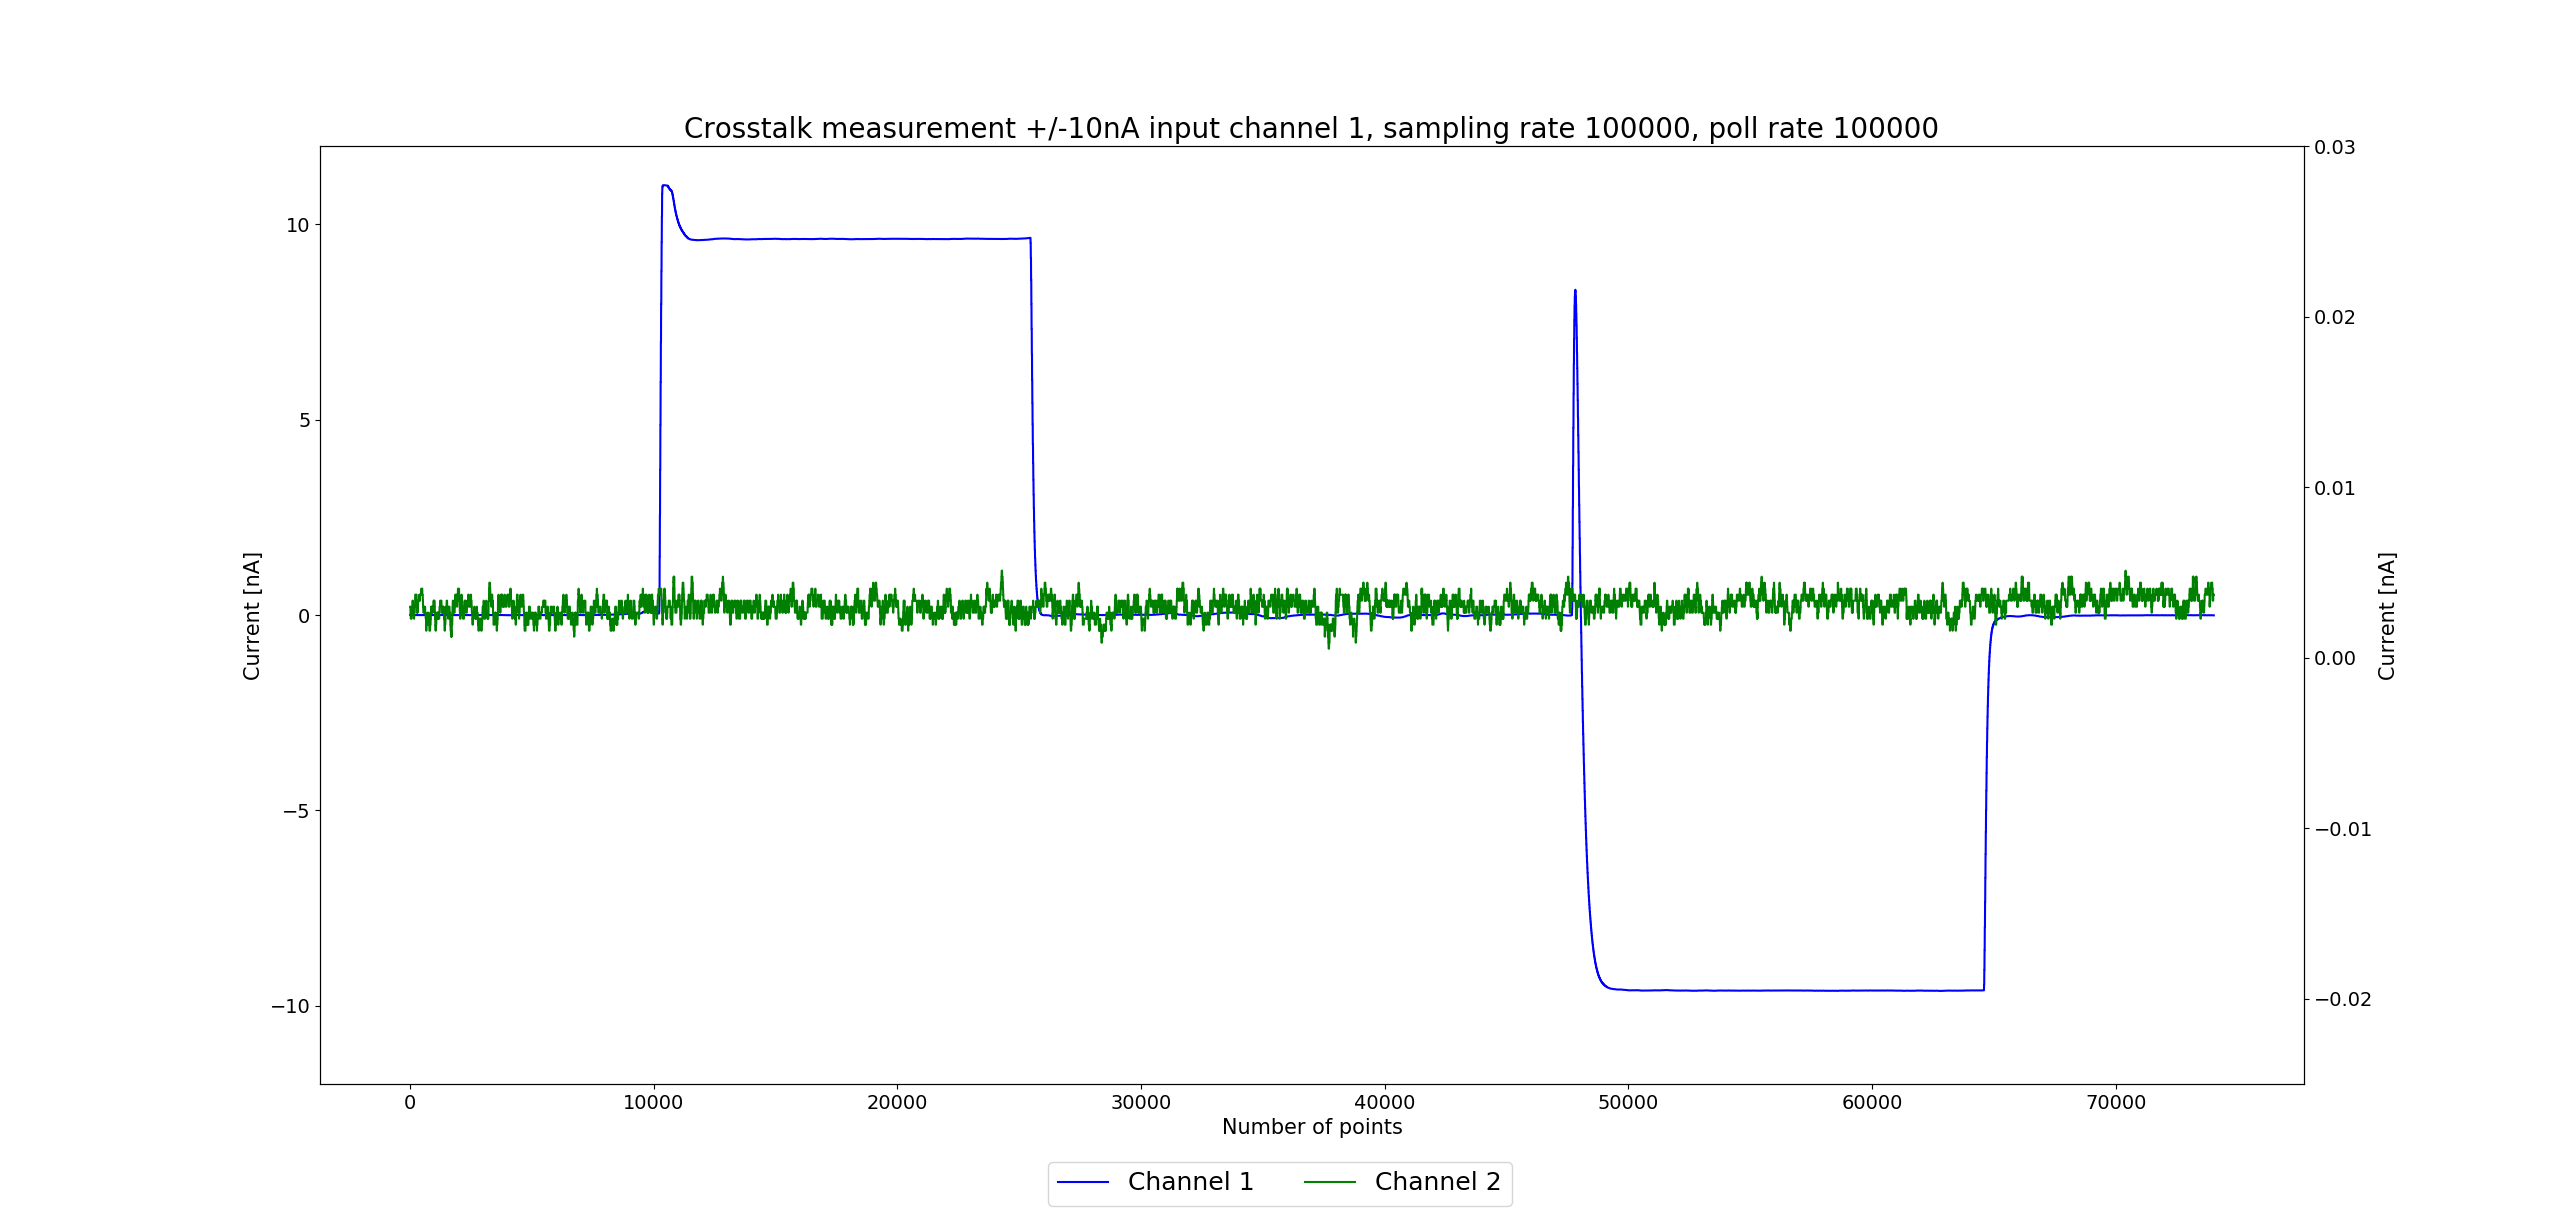
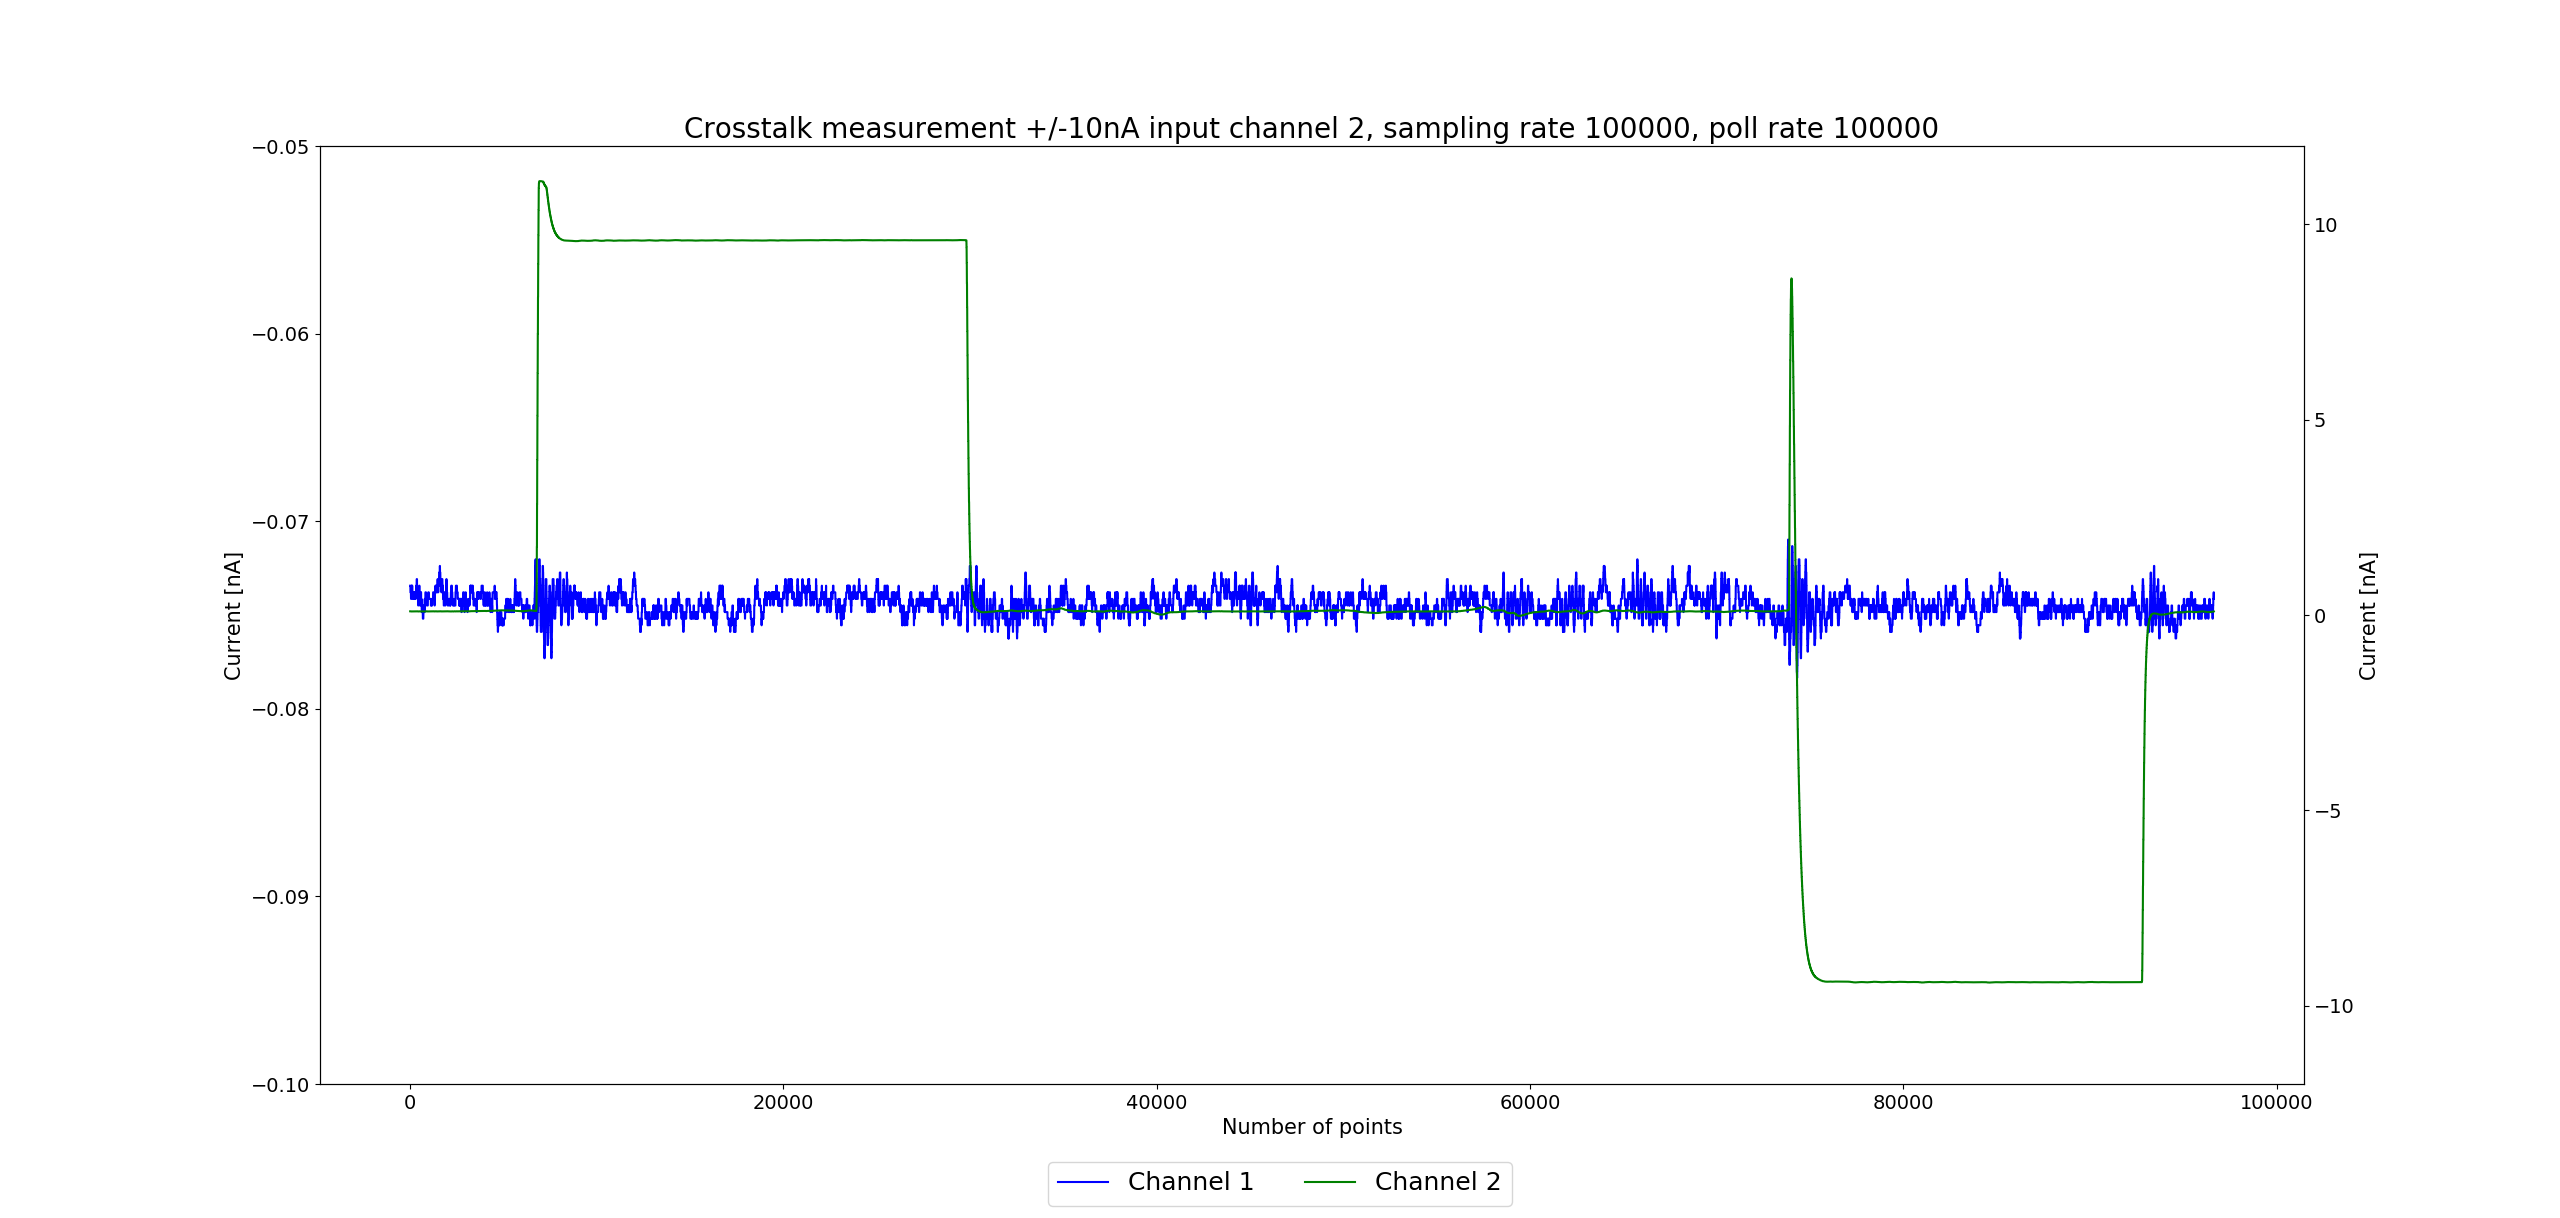
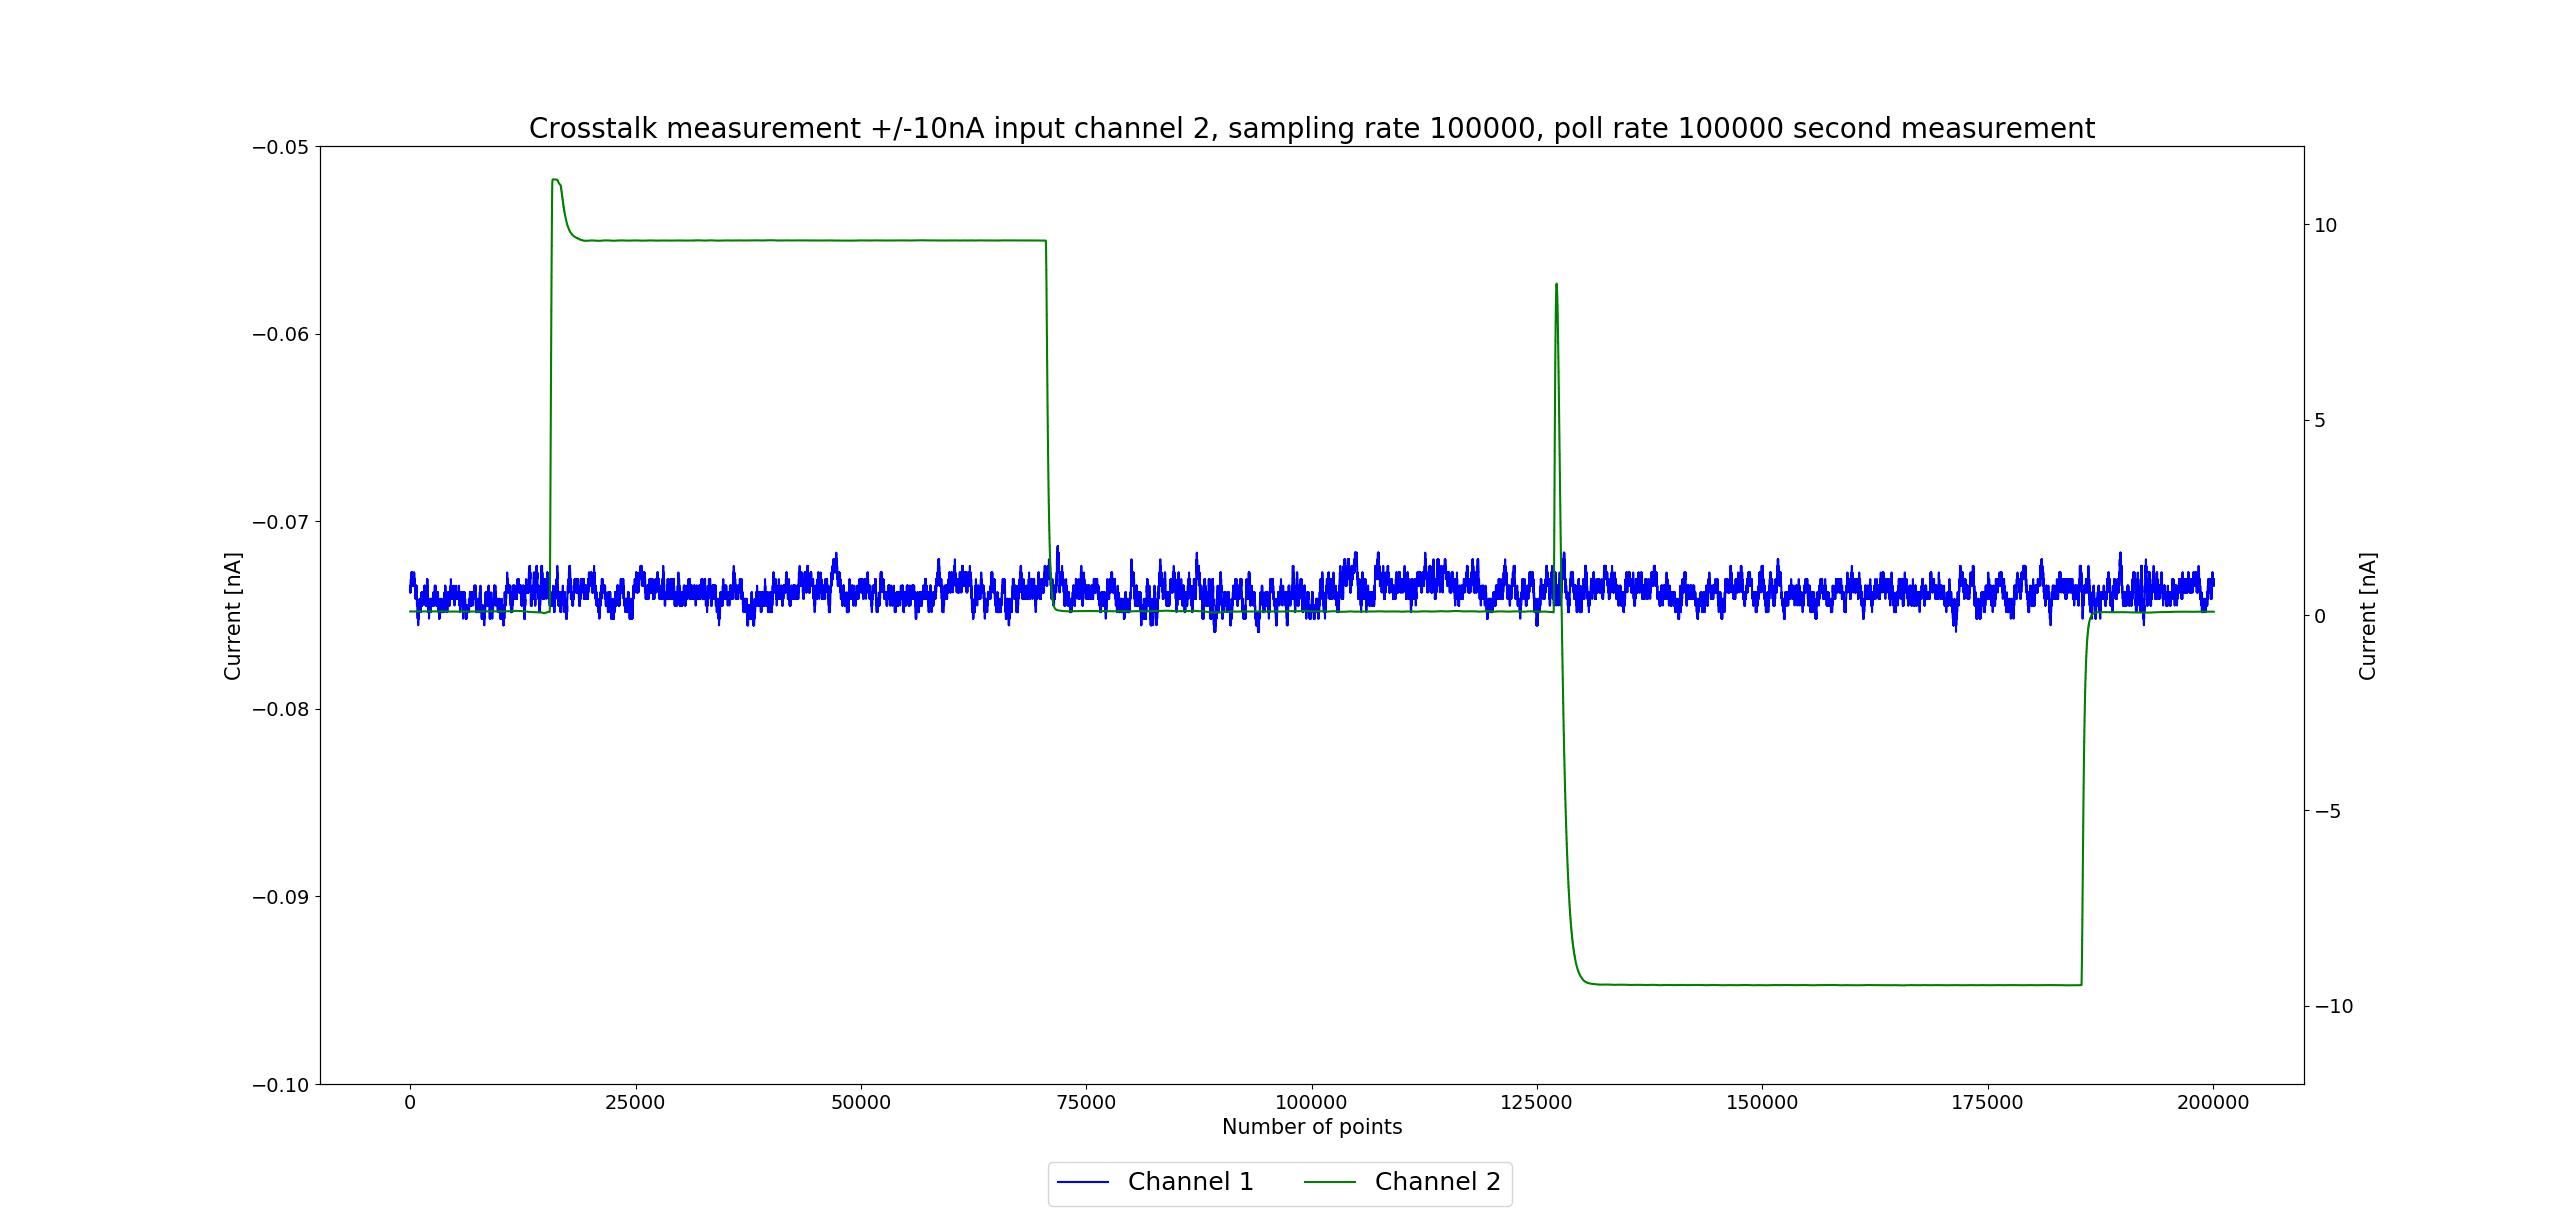
The measurement was done with sample rate of 100000 S/s and poll rate 100000, input of +/-10 nA. The data for channel 1 and channel 2 is recorded and shown on the figures below as one channel is switched between +10 nA and -10 nA.
Measurement of noise
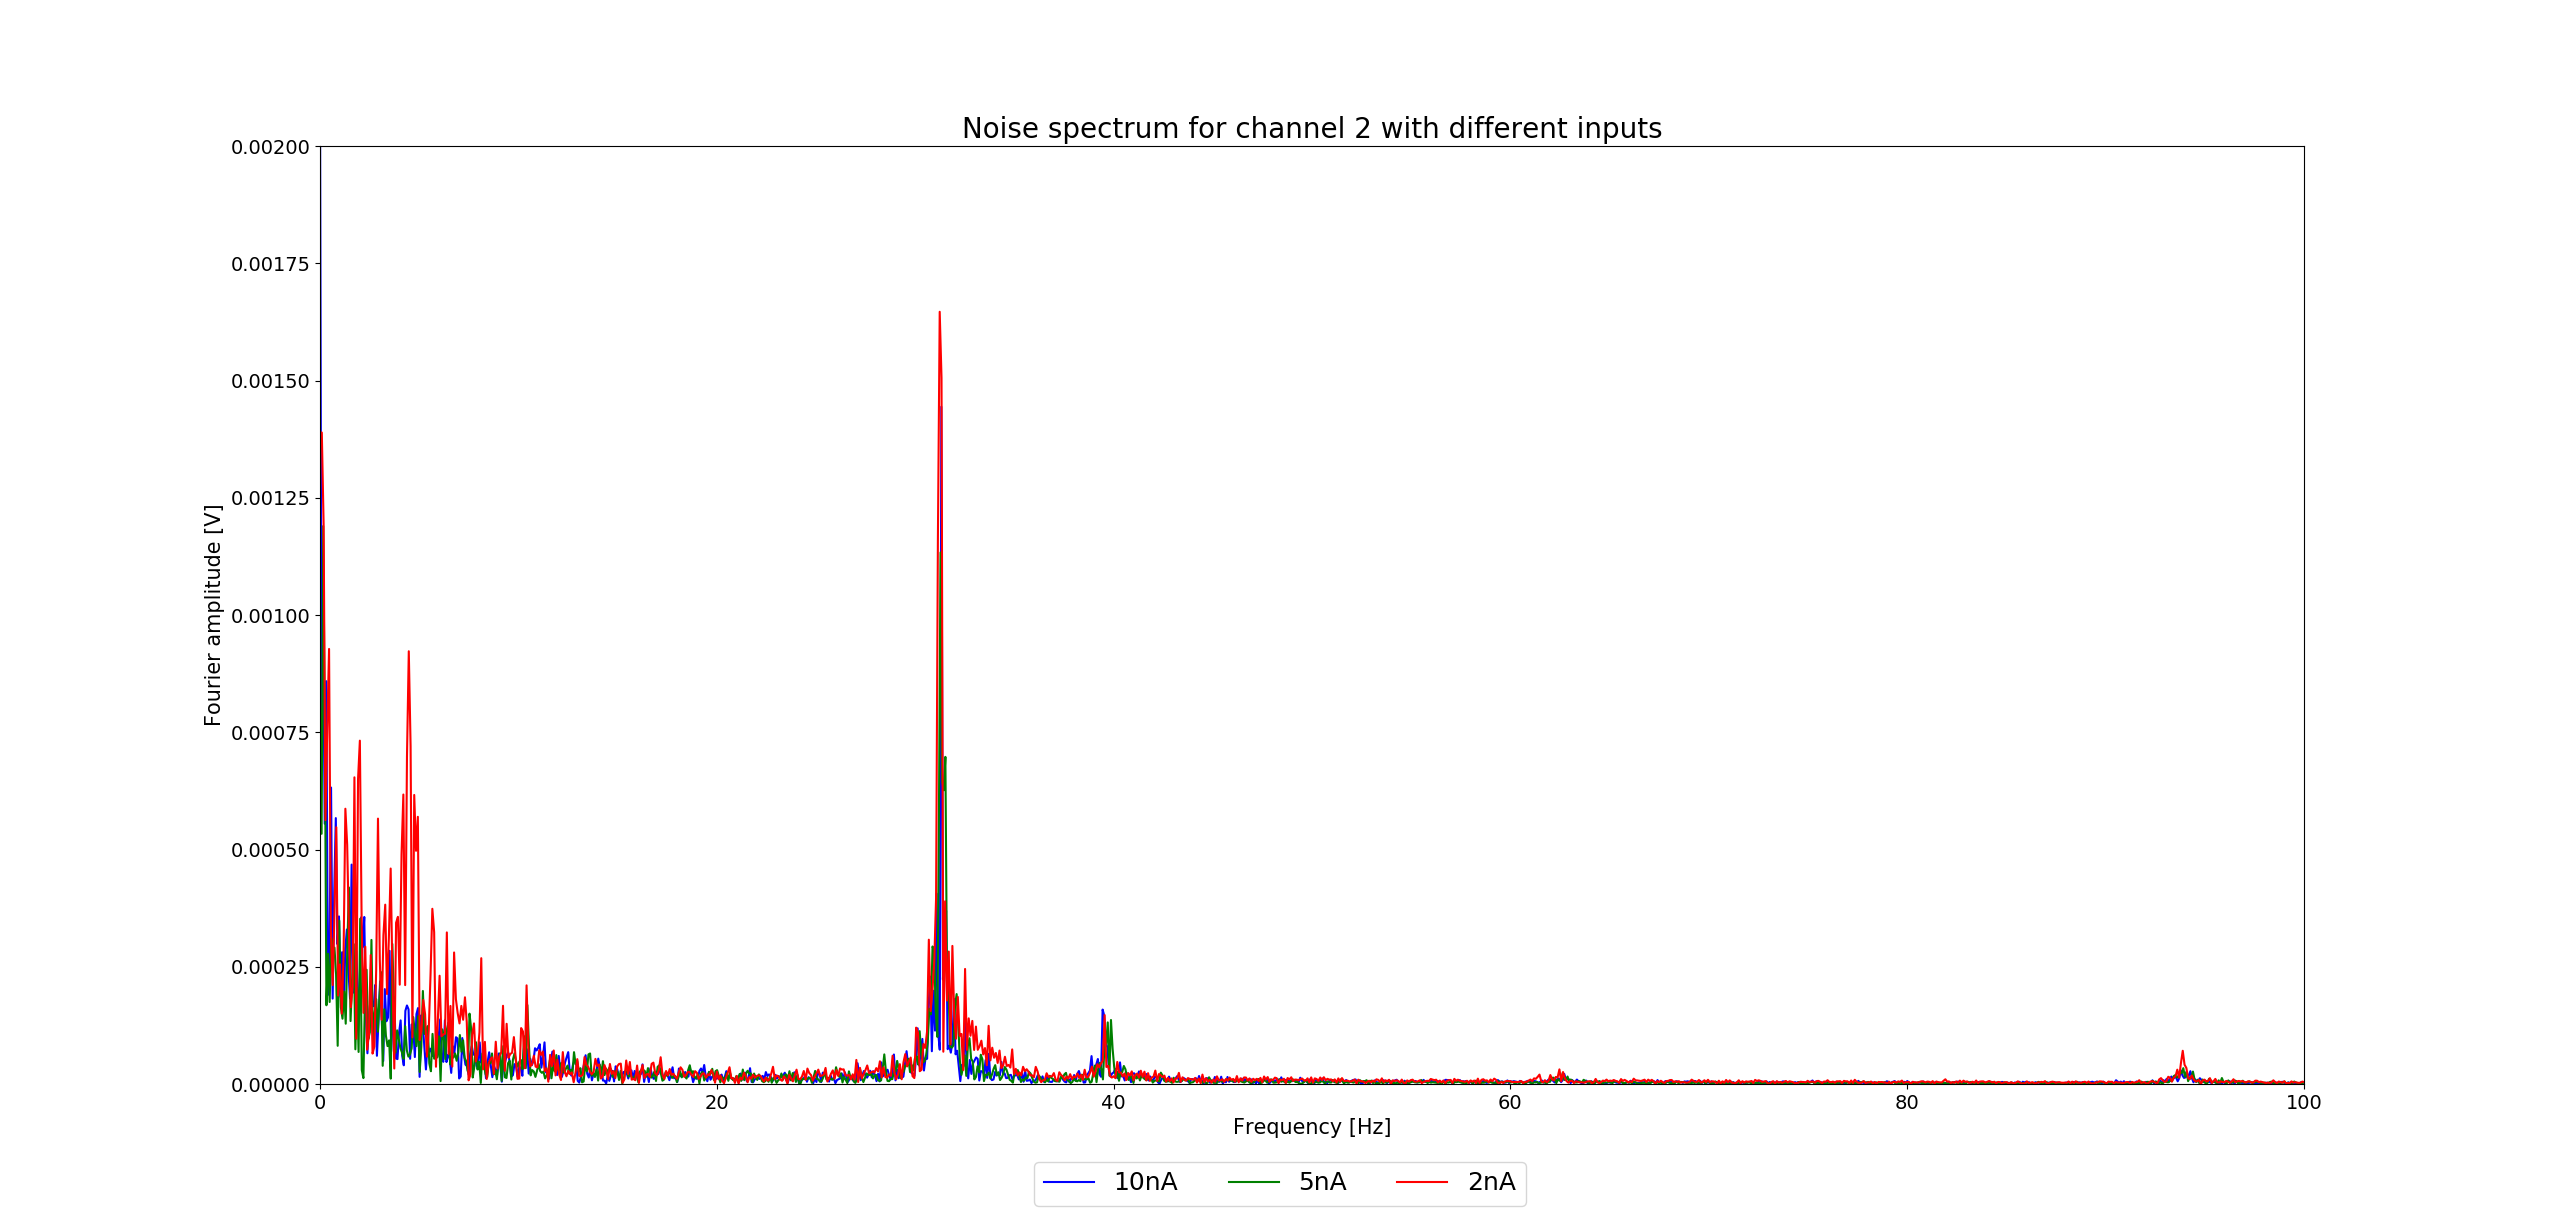
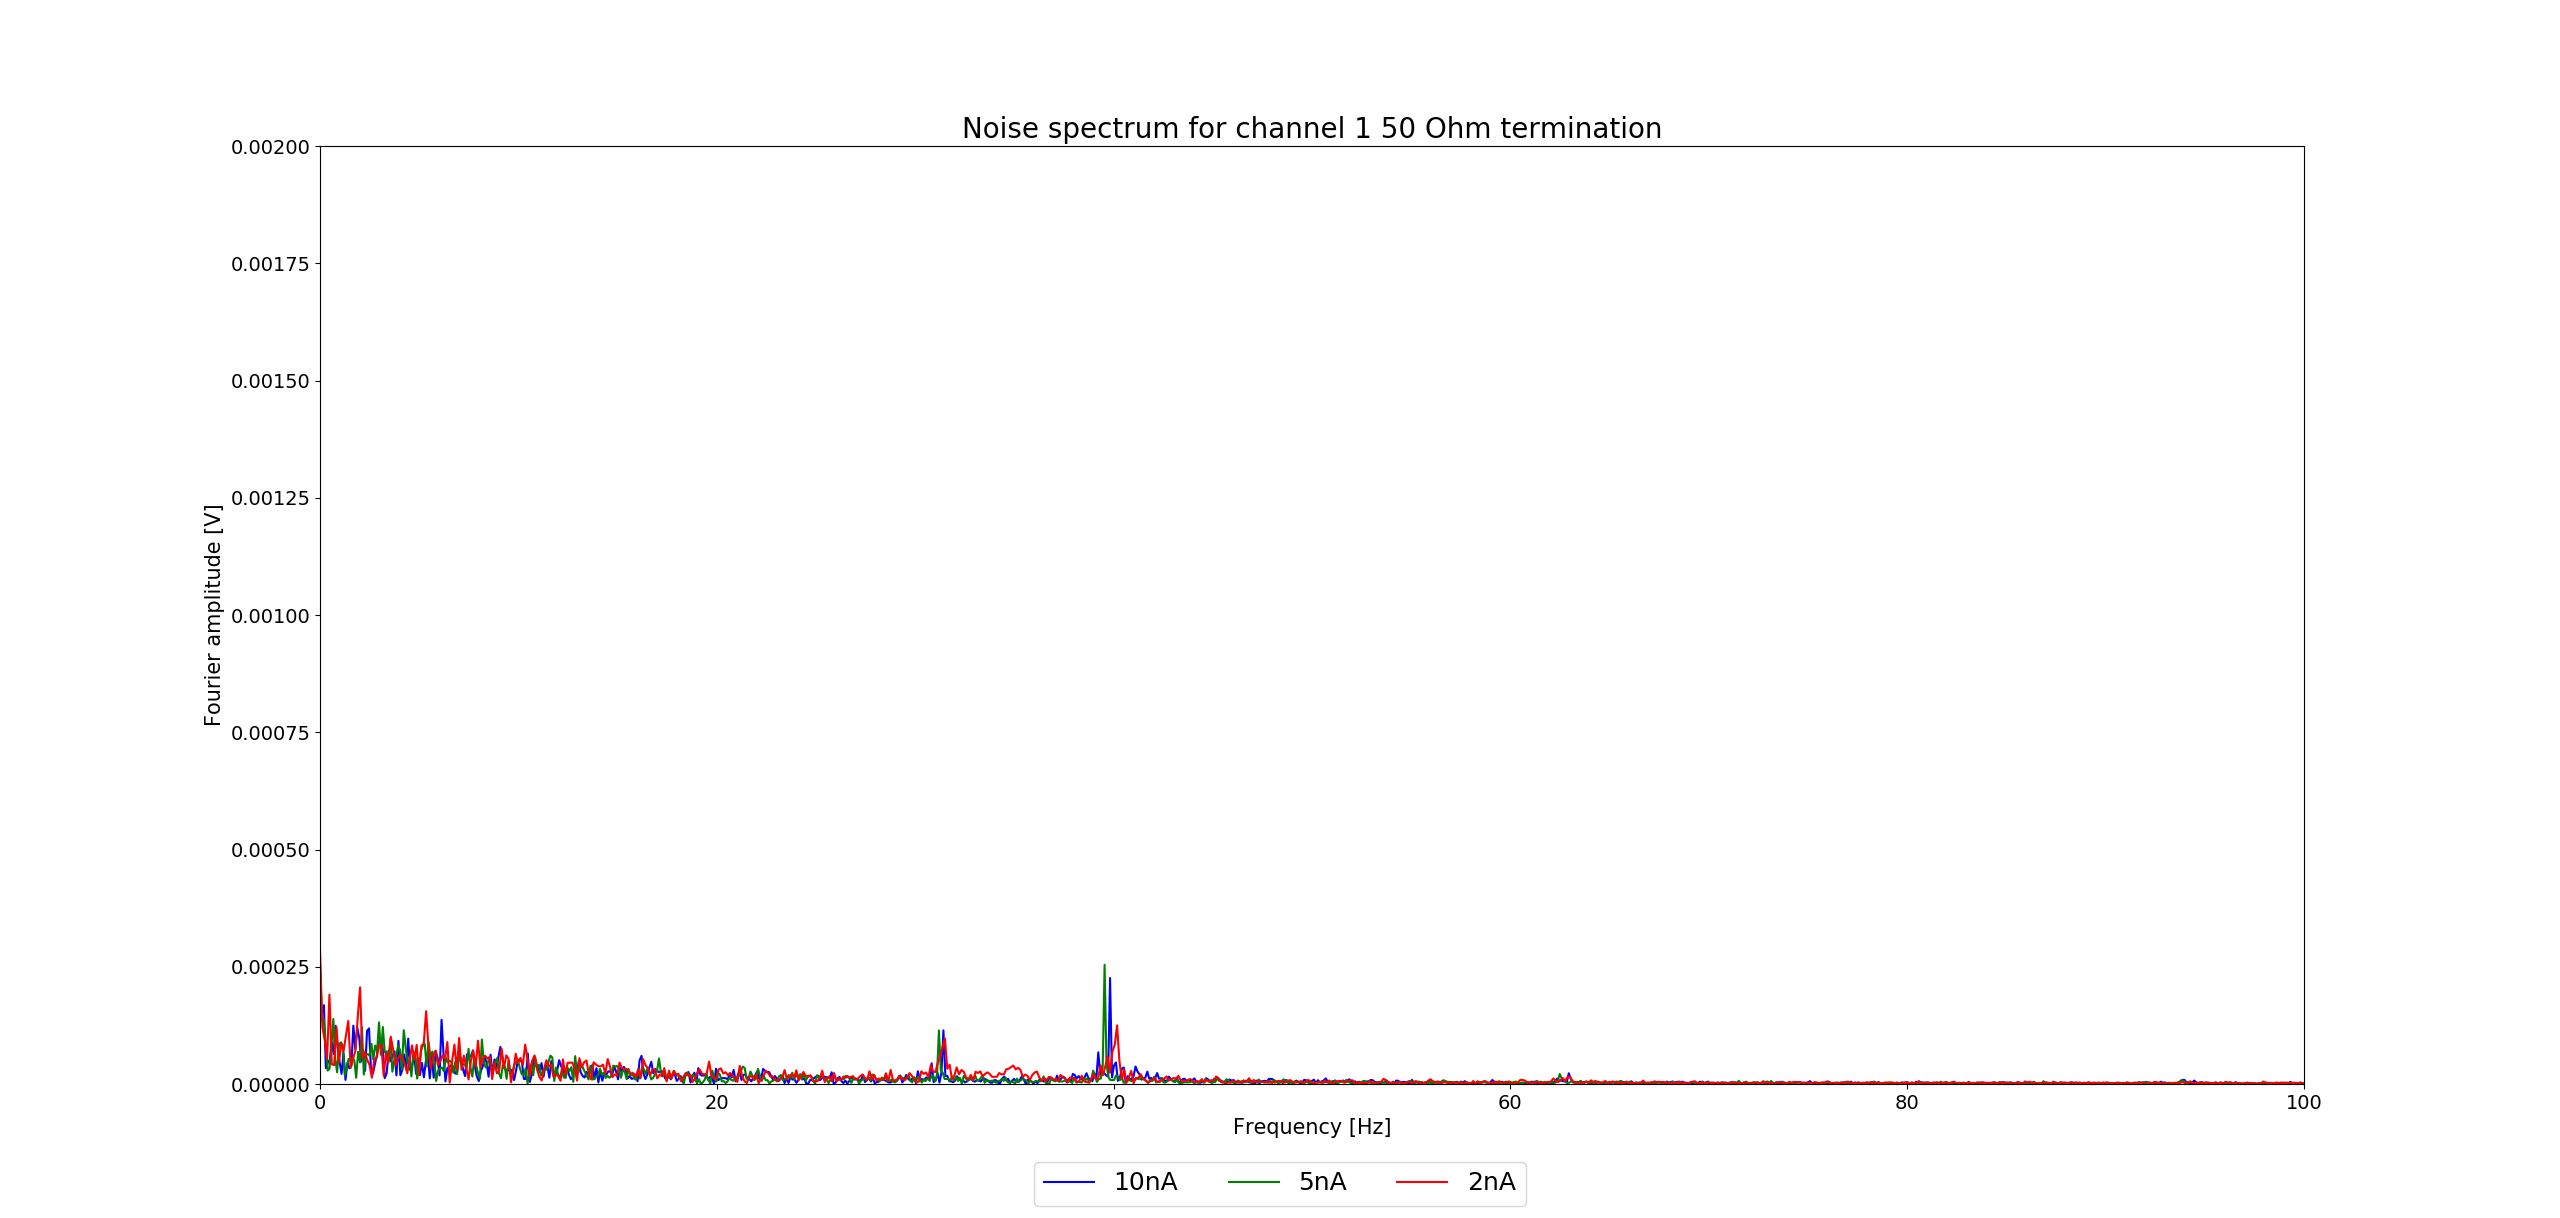
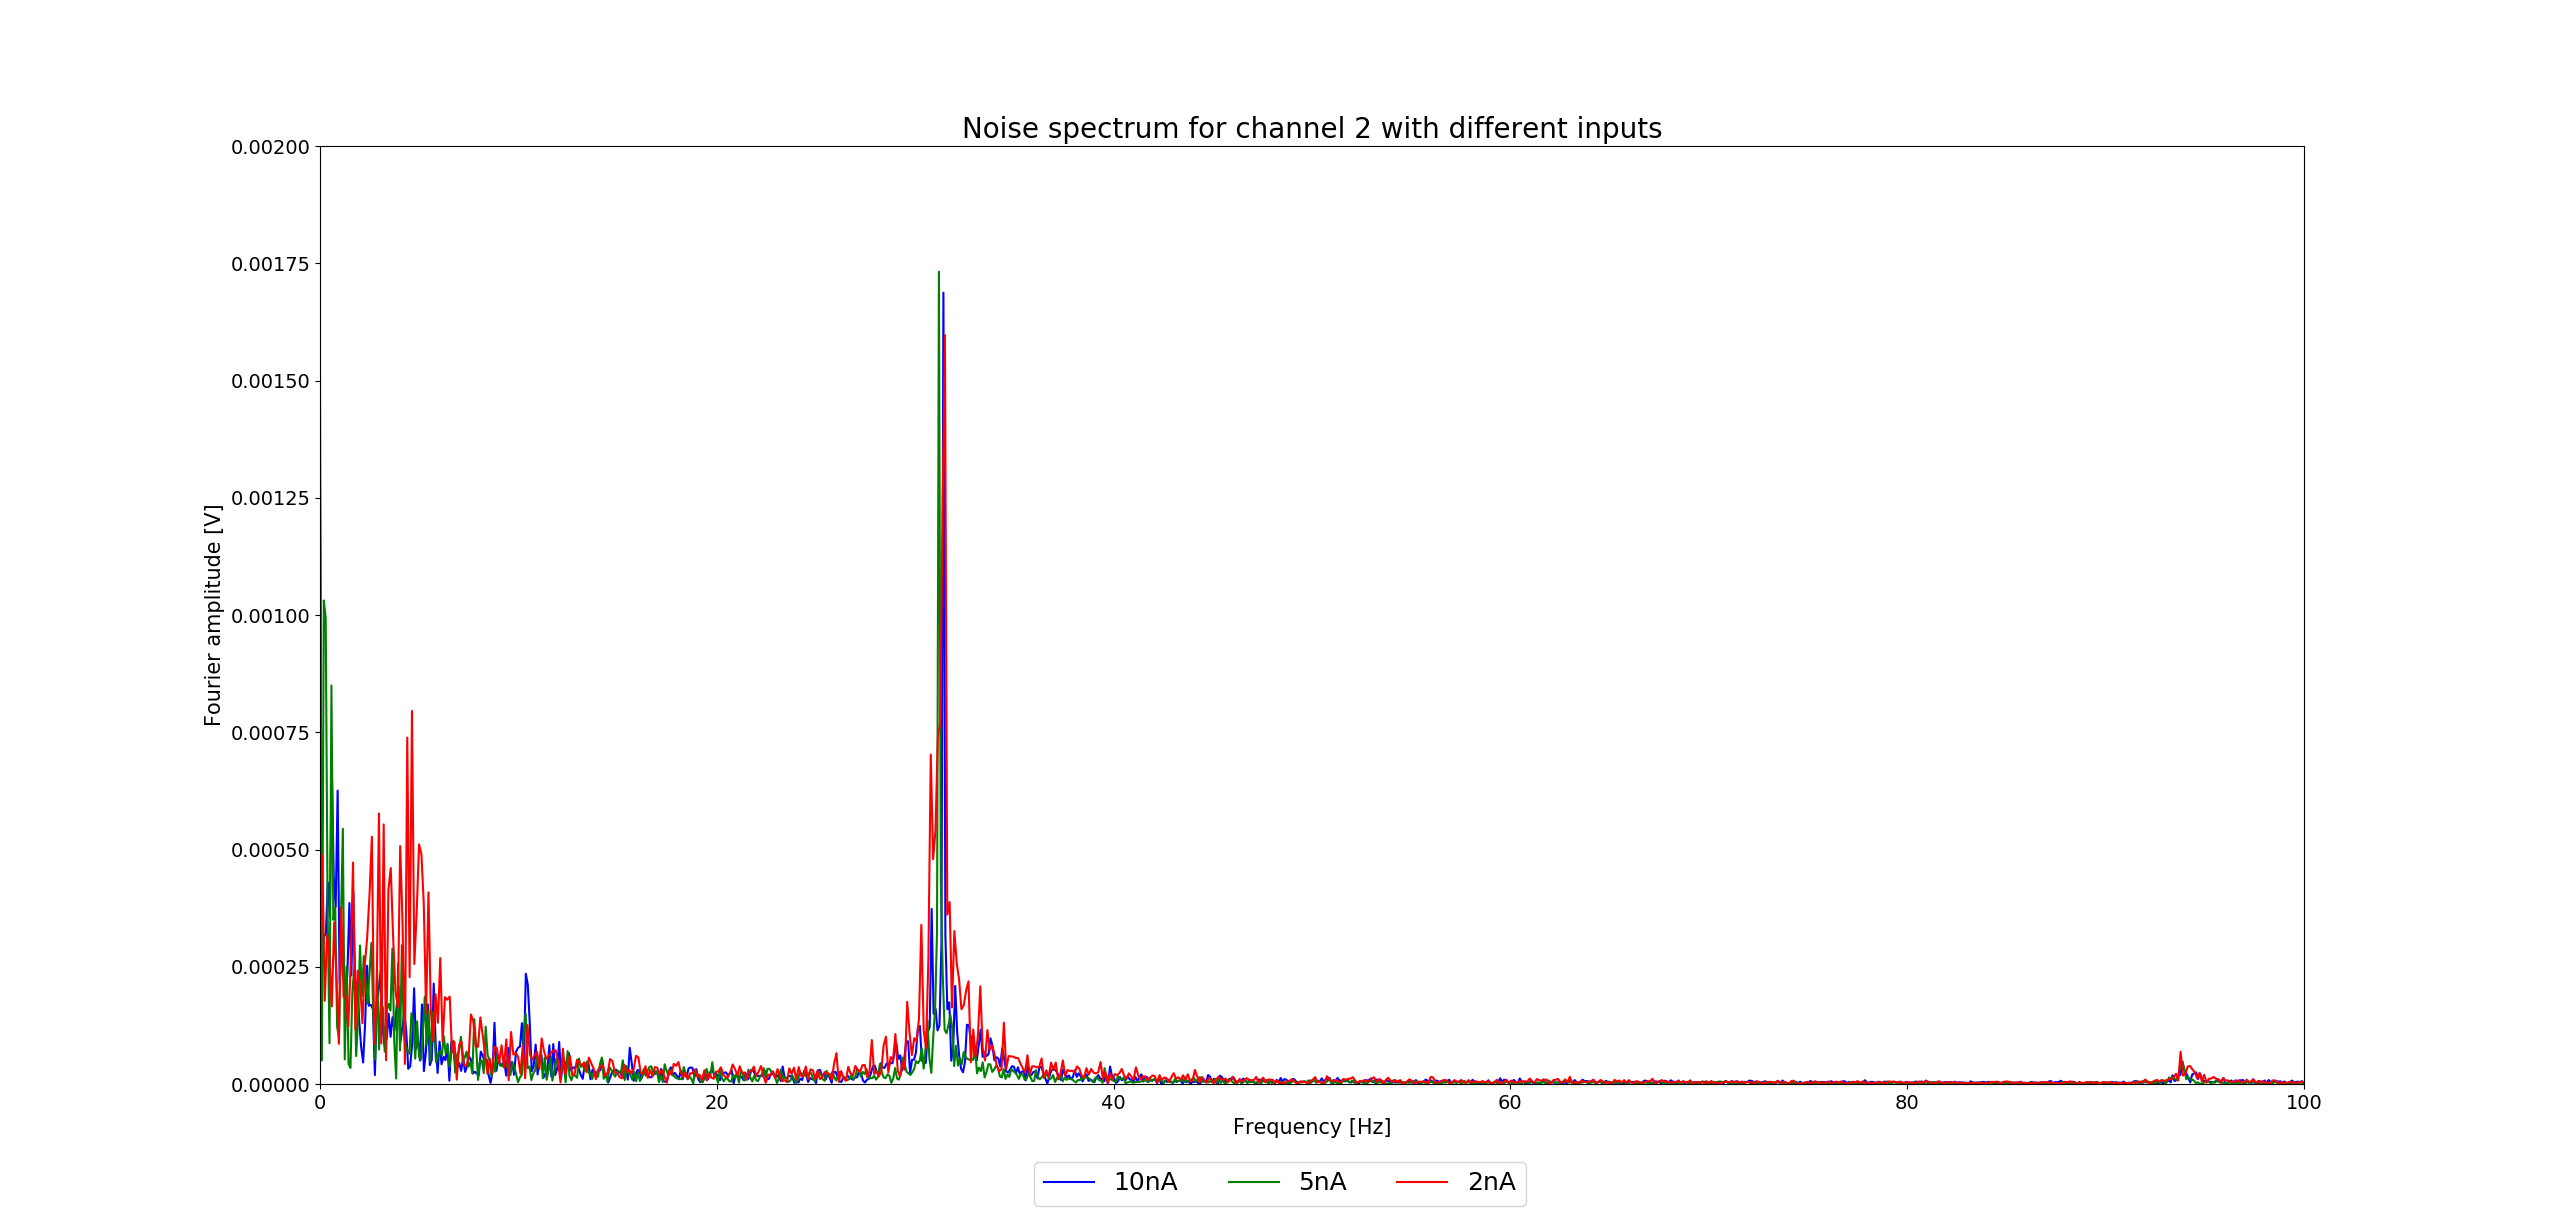
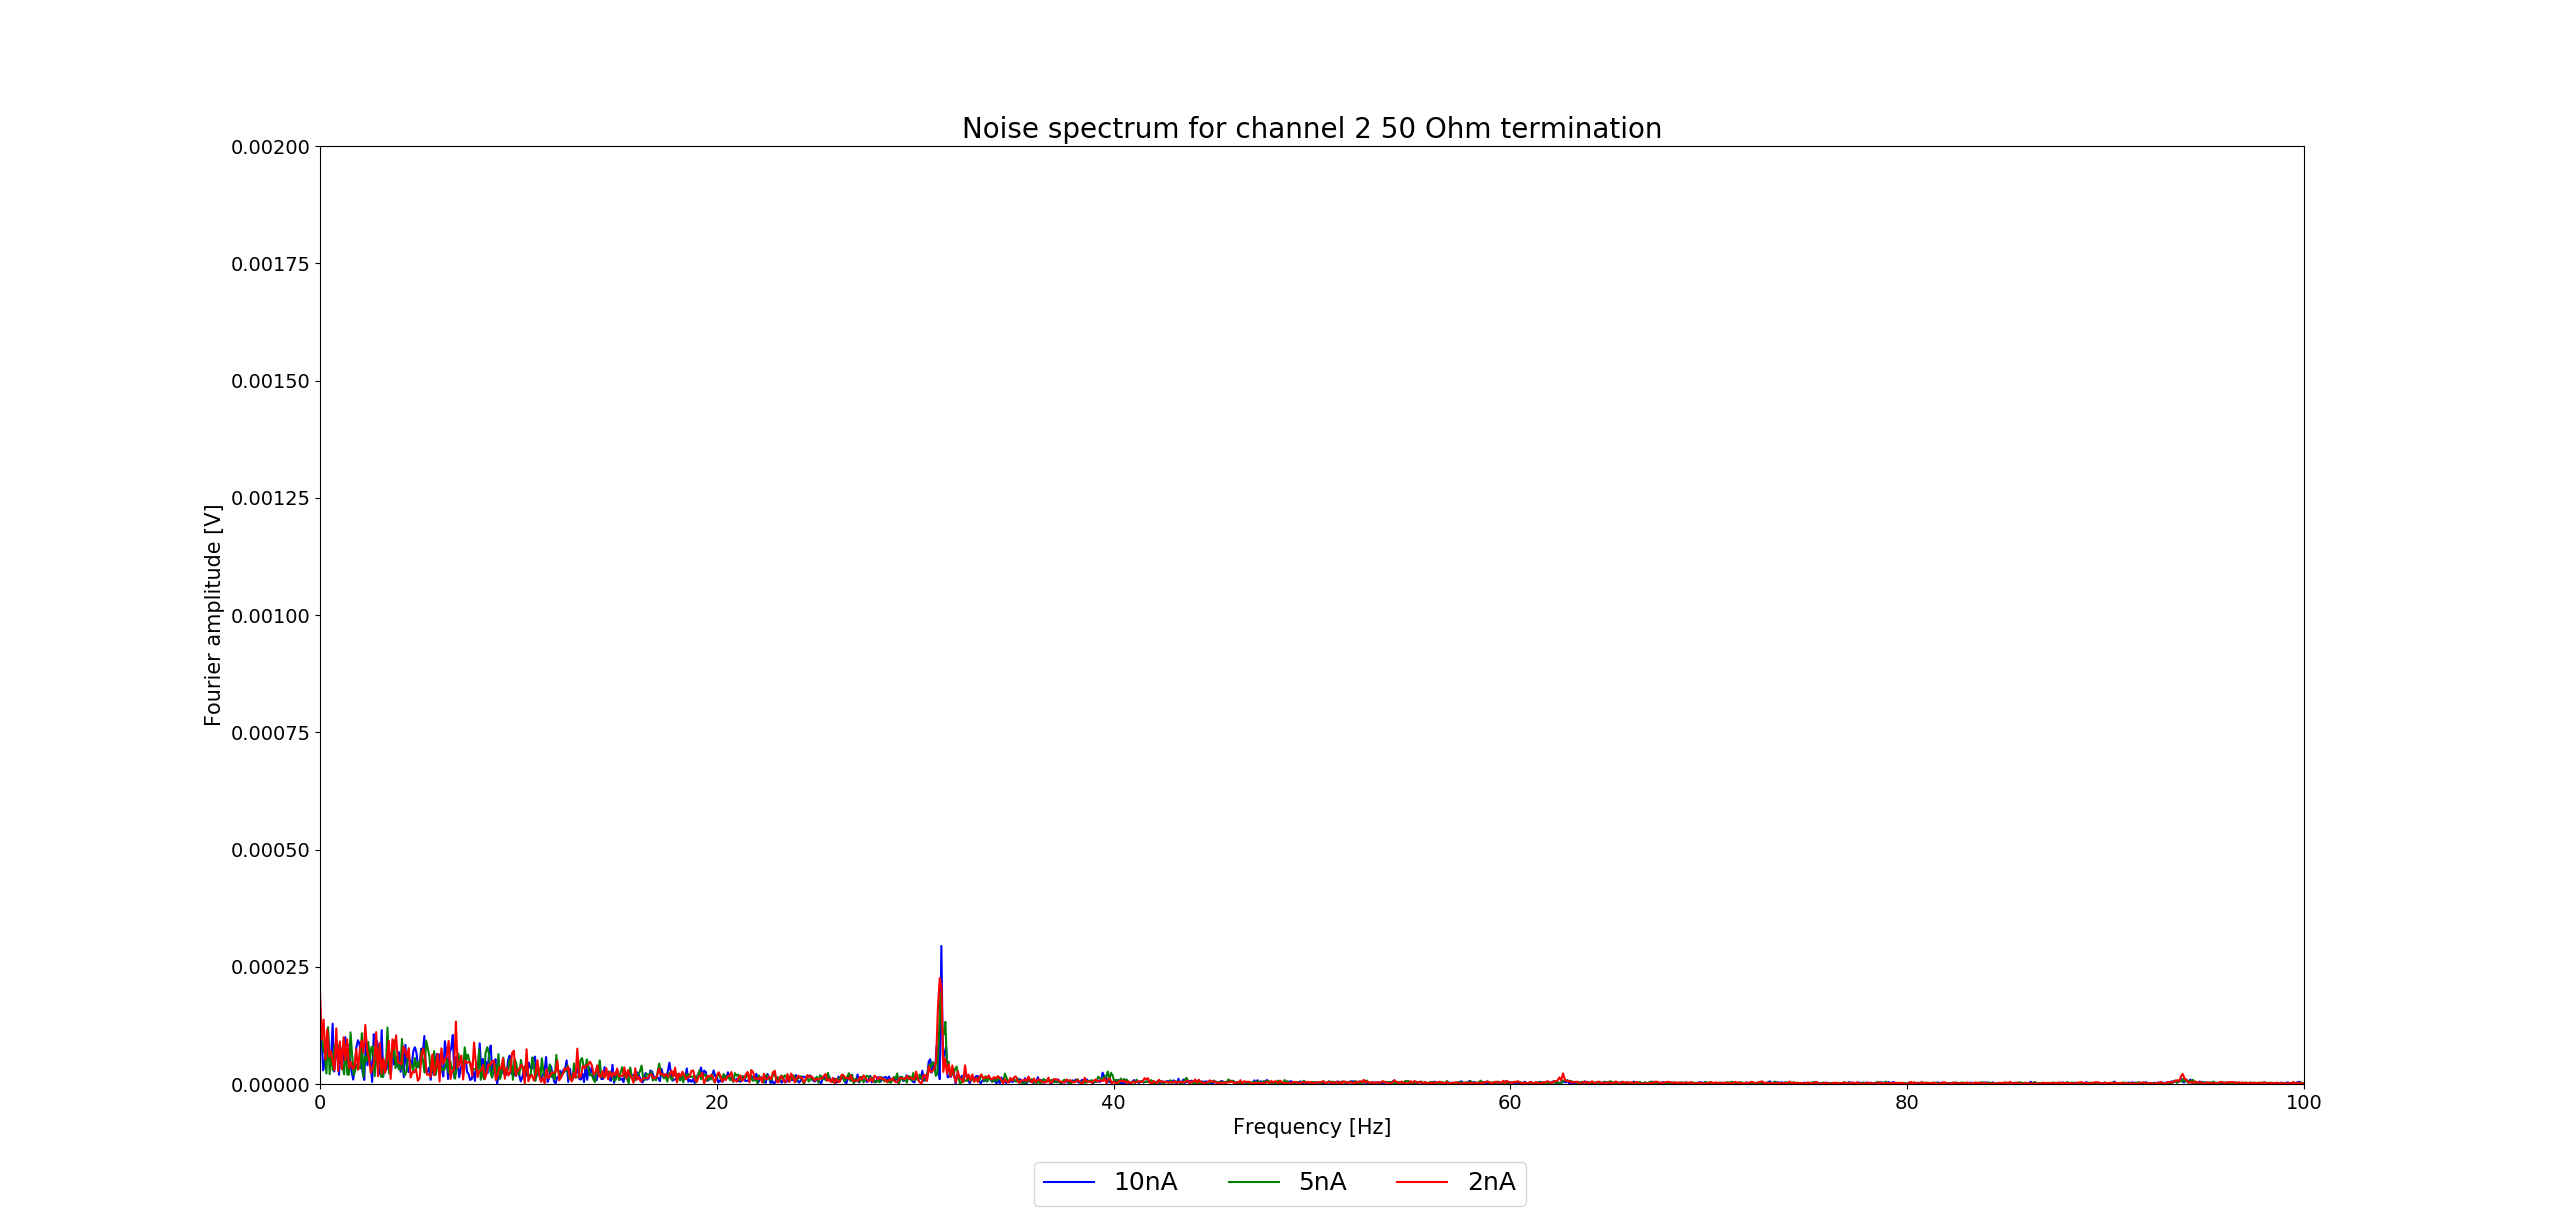
In this measurement the Keysight is to various input currents (10, 5, 2 nA) for a given channel with the sample rate and poll rate set to maximum. The channel not connected to the power supply has a 50 Ohm termination added with the noise spectrum also shown. The noise was measured up to 10000 Hz but no peaks are visible so the graph is cut to 100 Hz to show the signals in the low range.
Measurement of stability
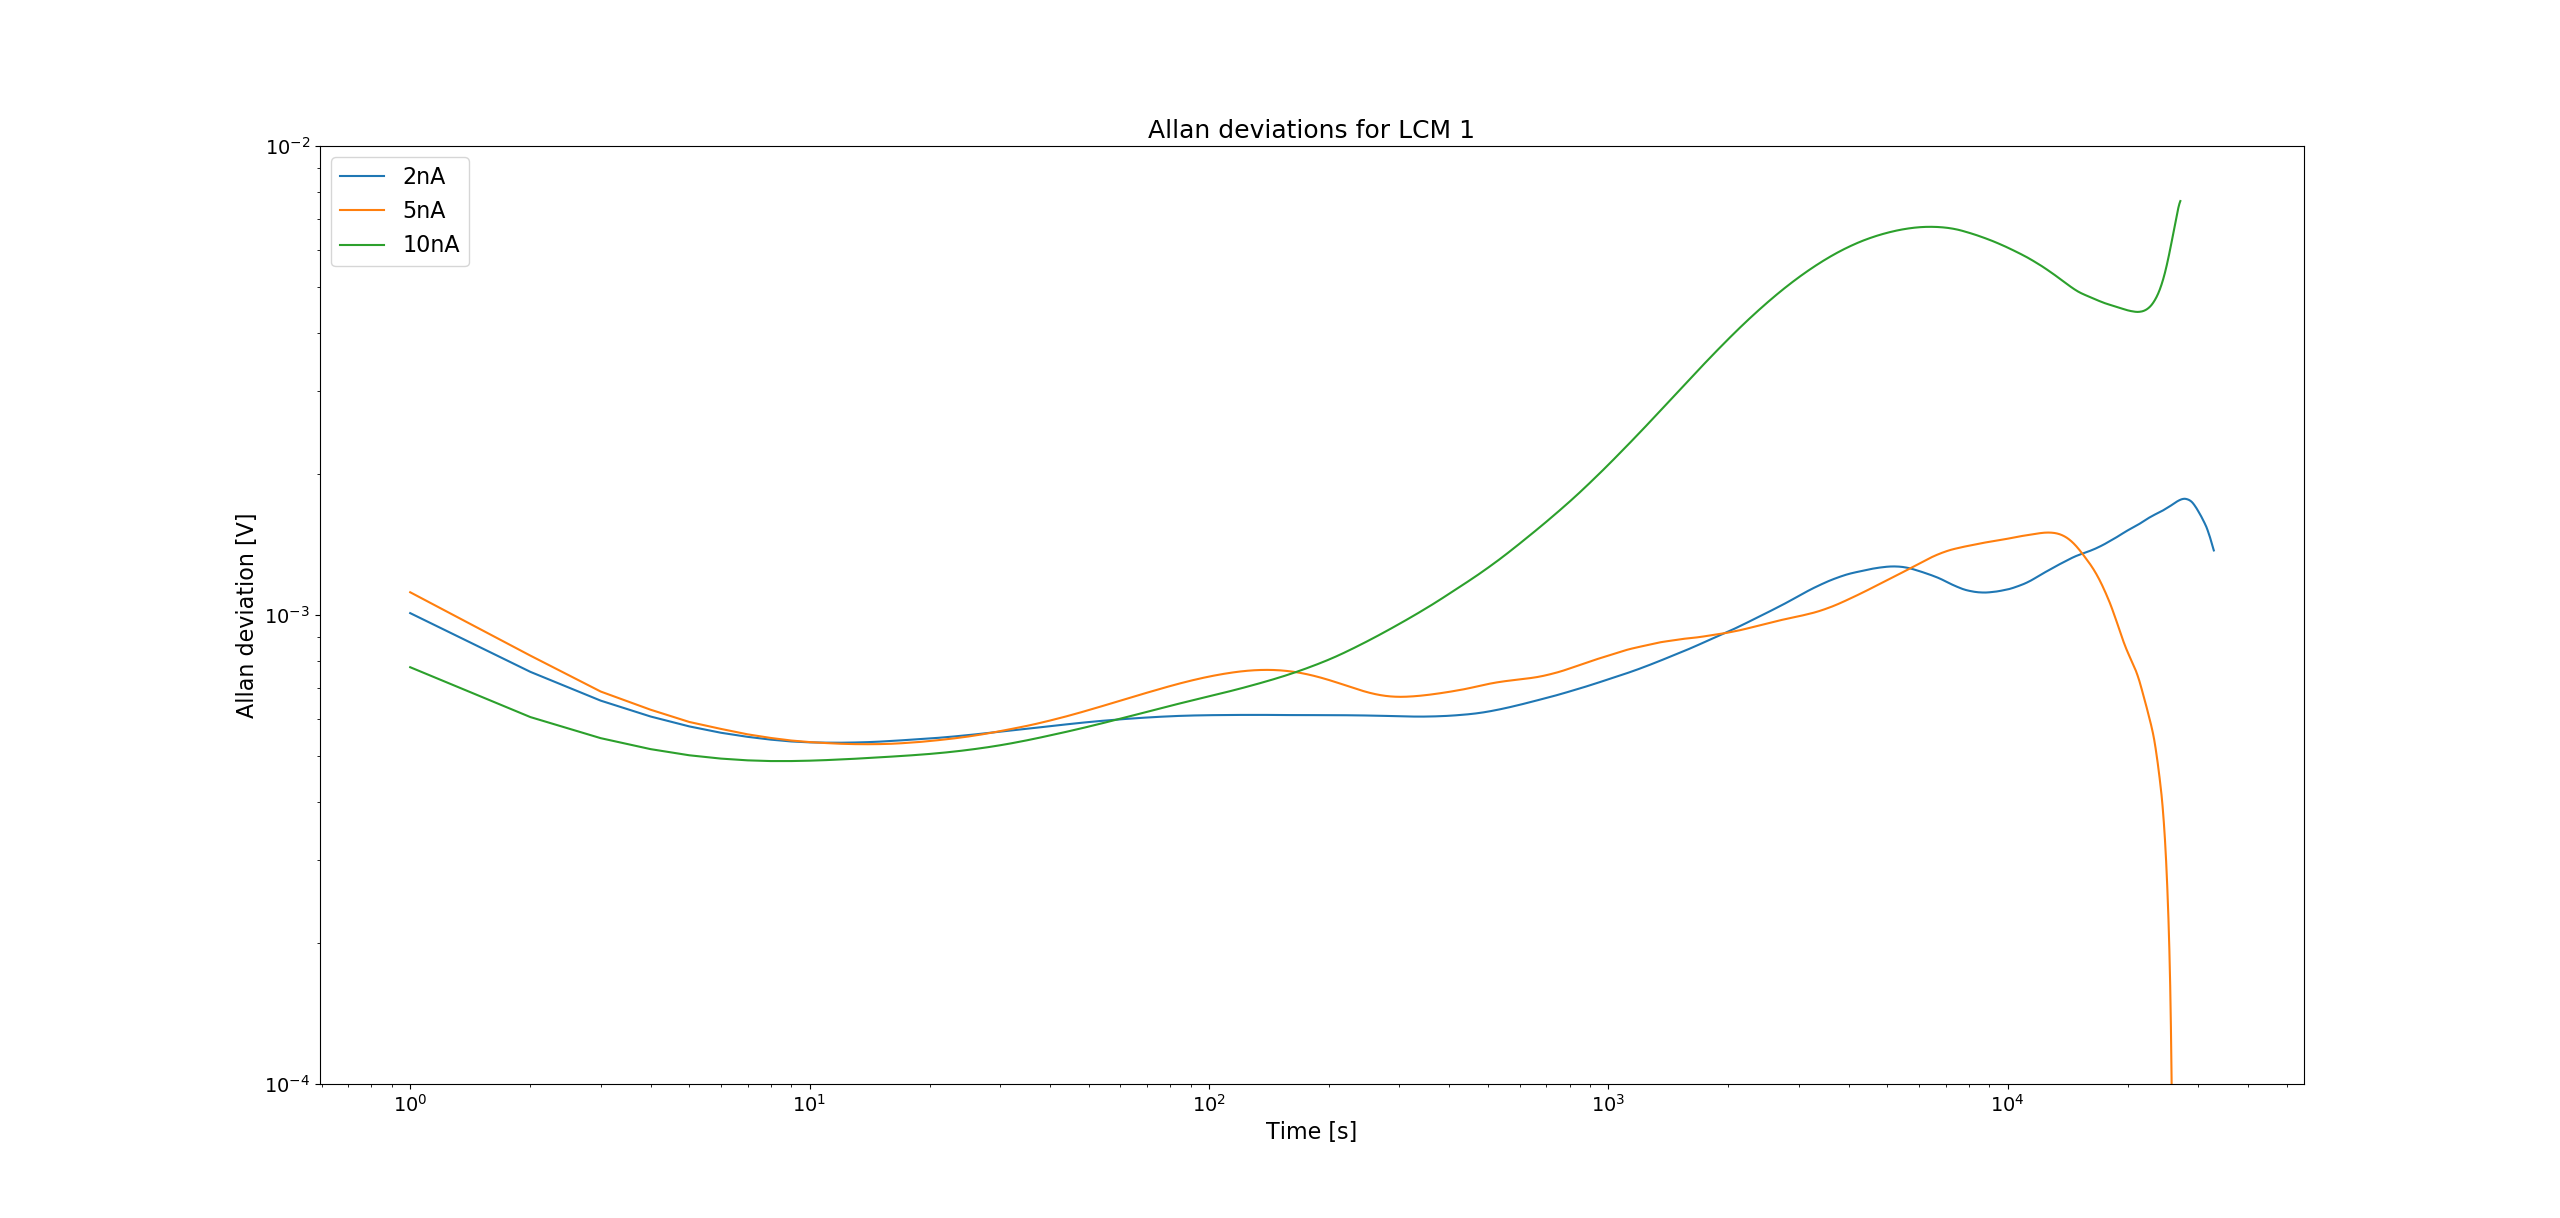
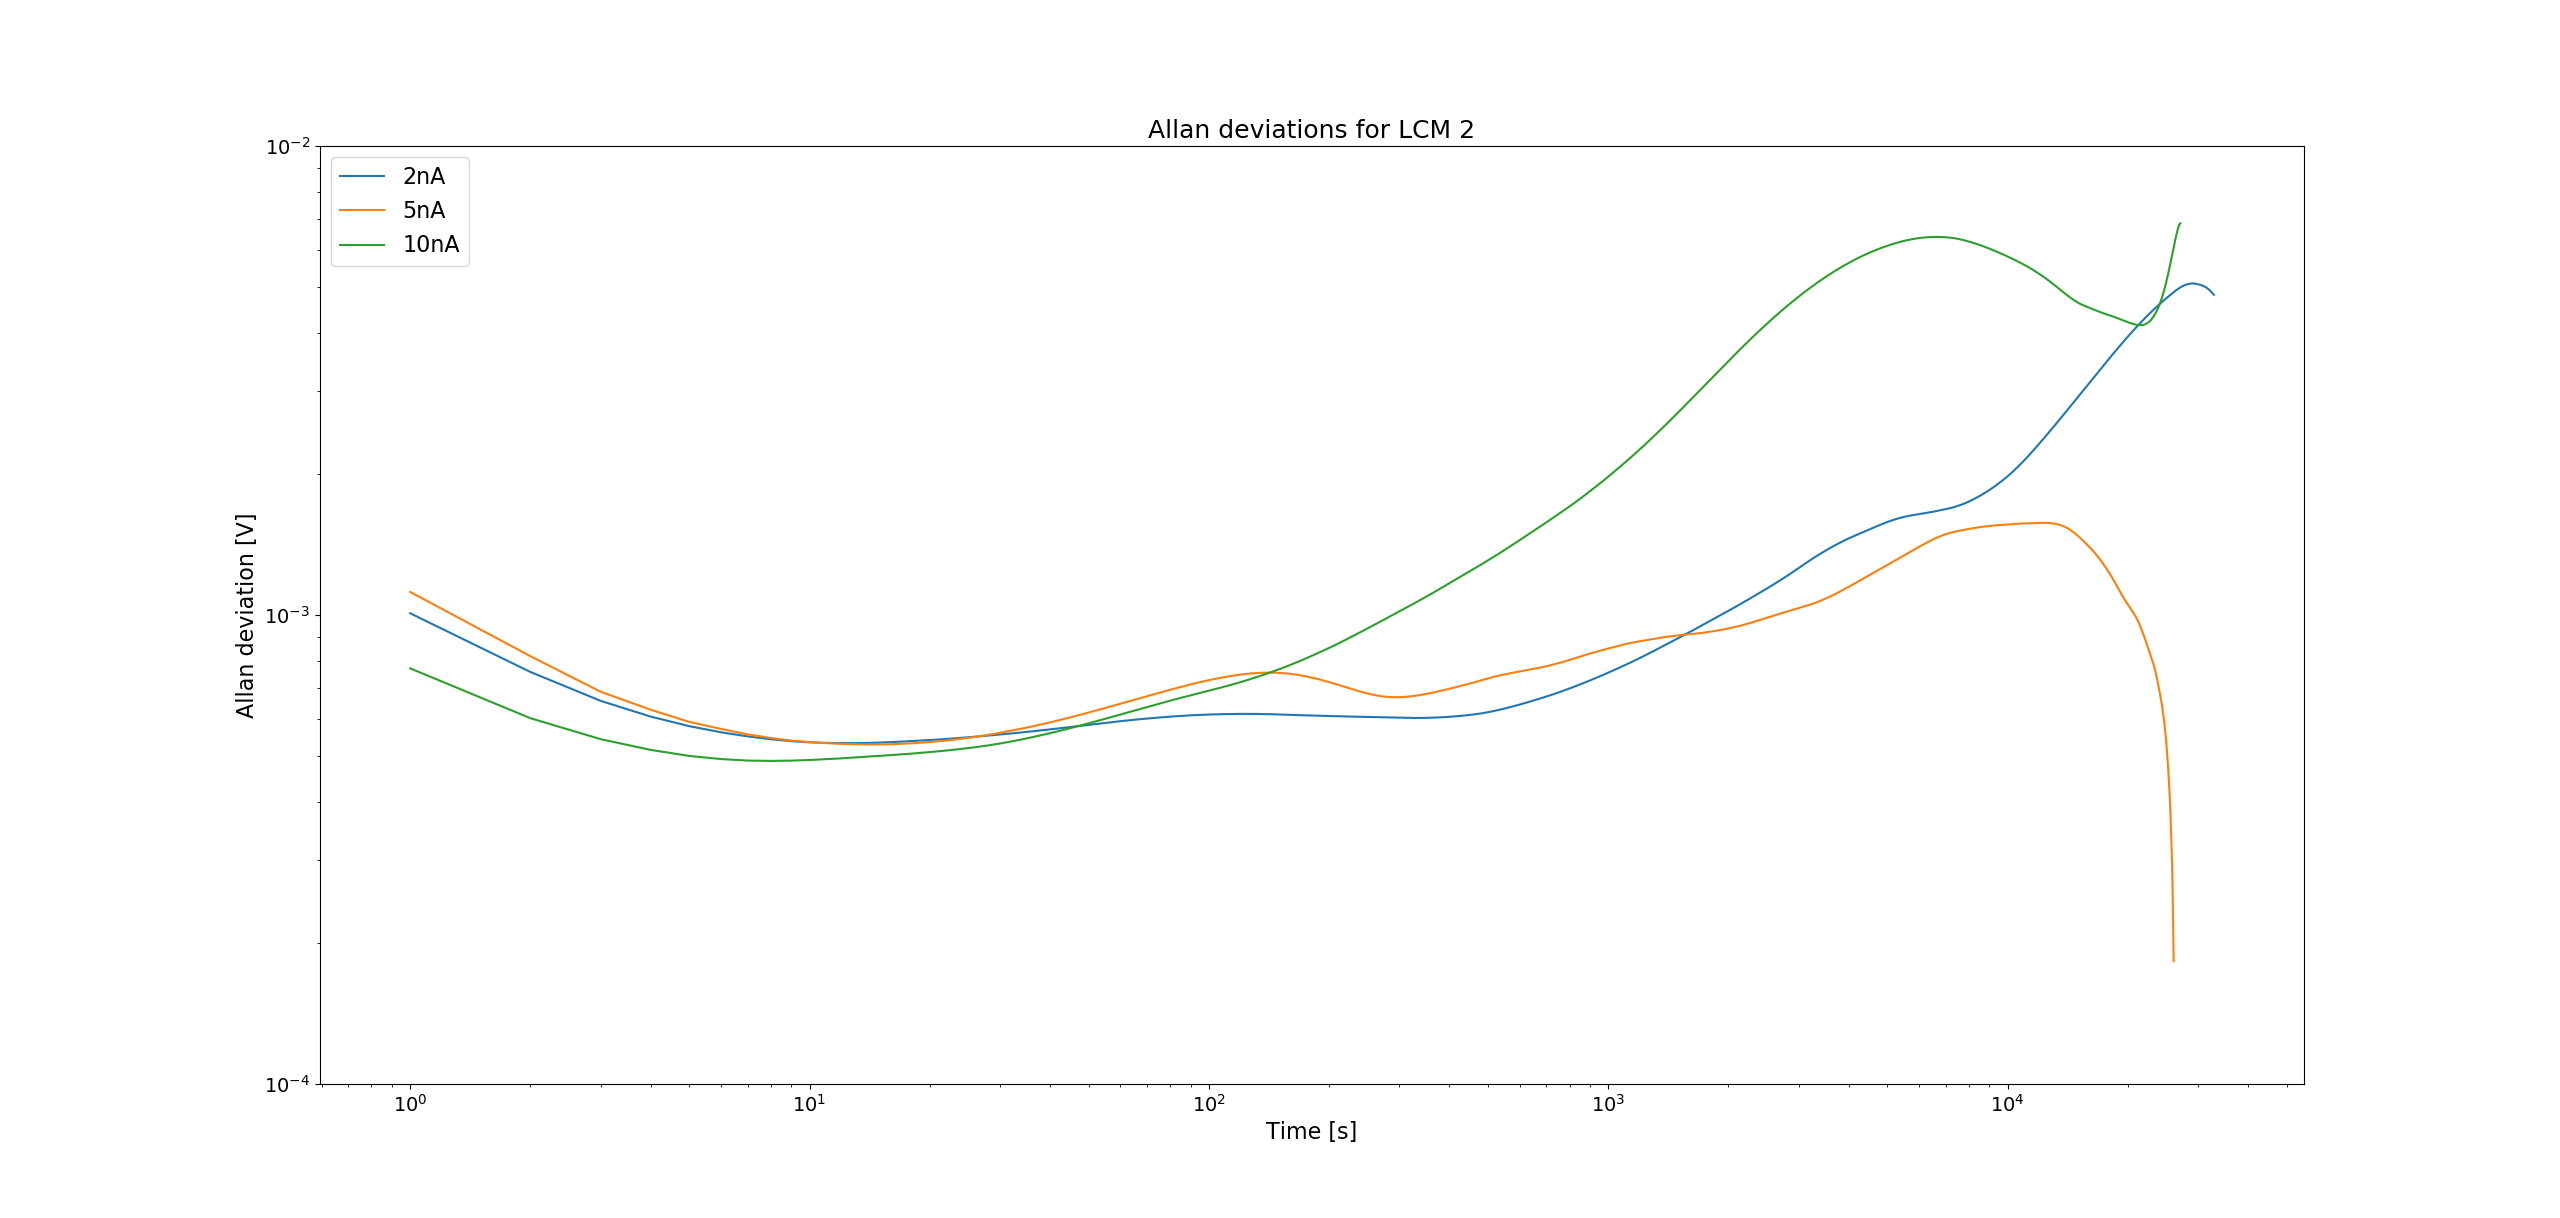
The stability of the device is measured over a period of 24 hours. The sample rate and poll rate is set to 10000. Then an Allan standard deviation is performed to realise the stability.
Measurement of the voltage offset
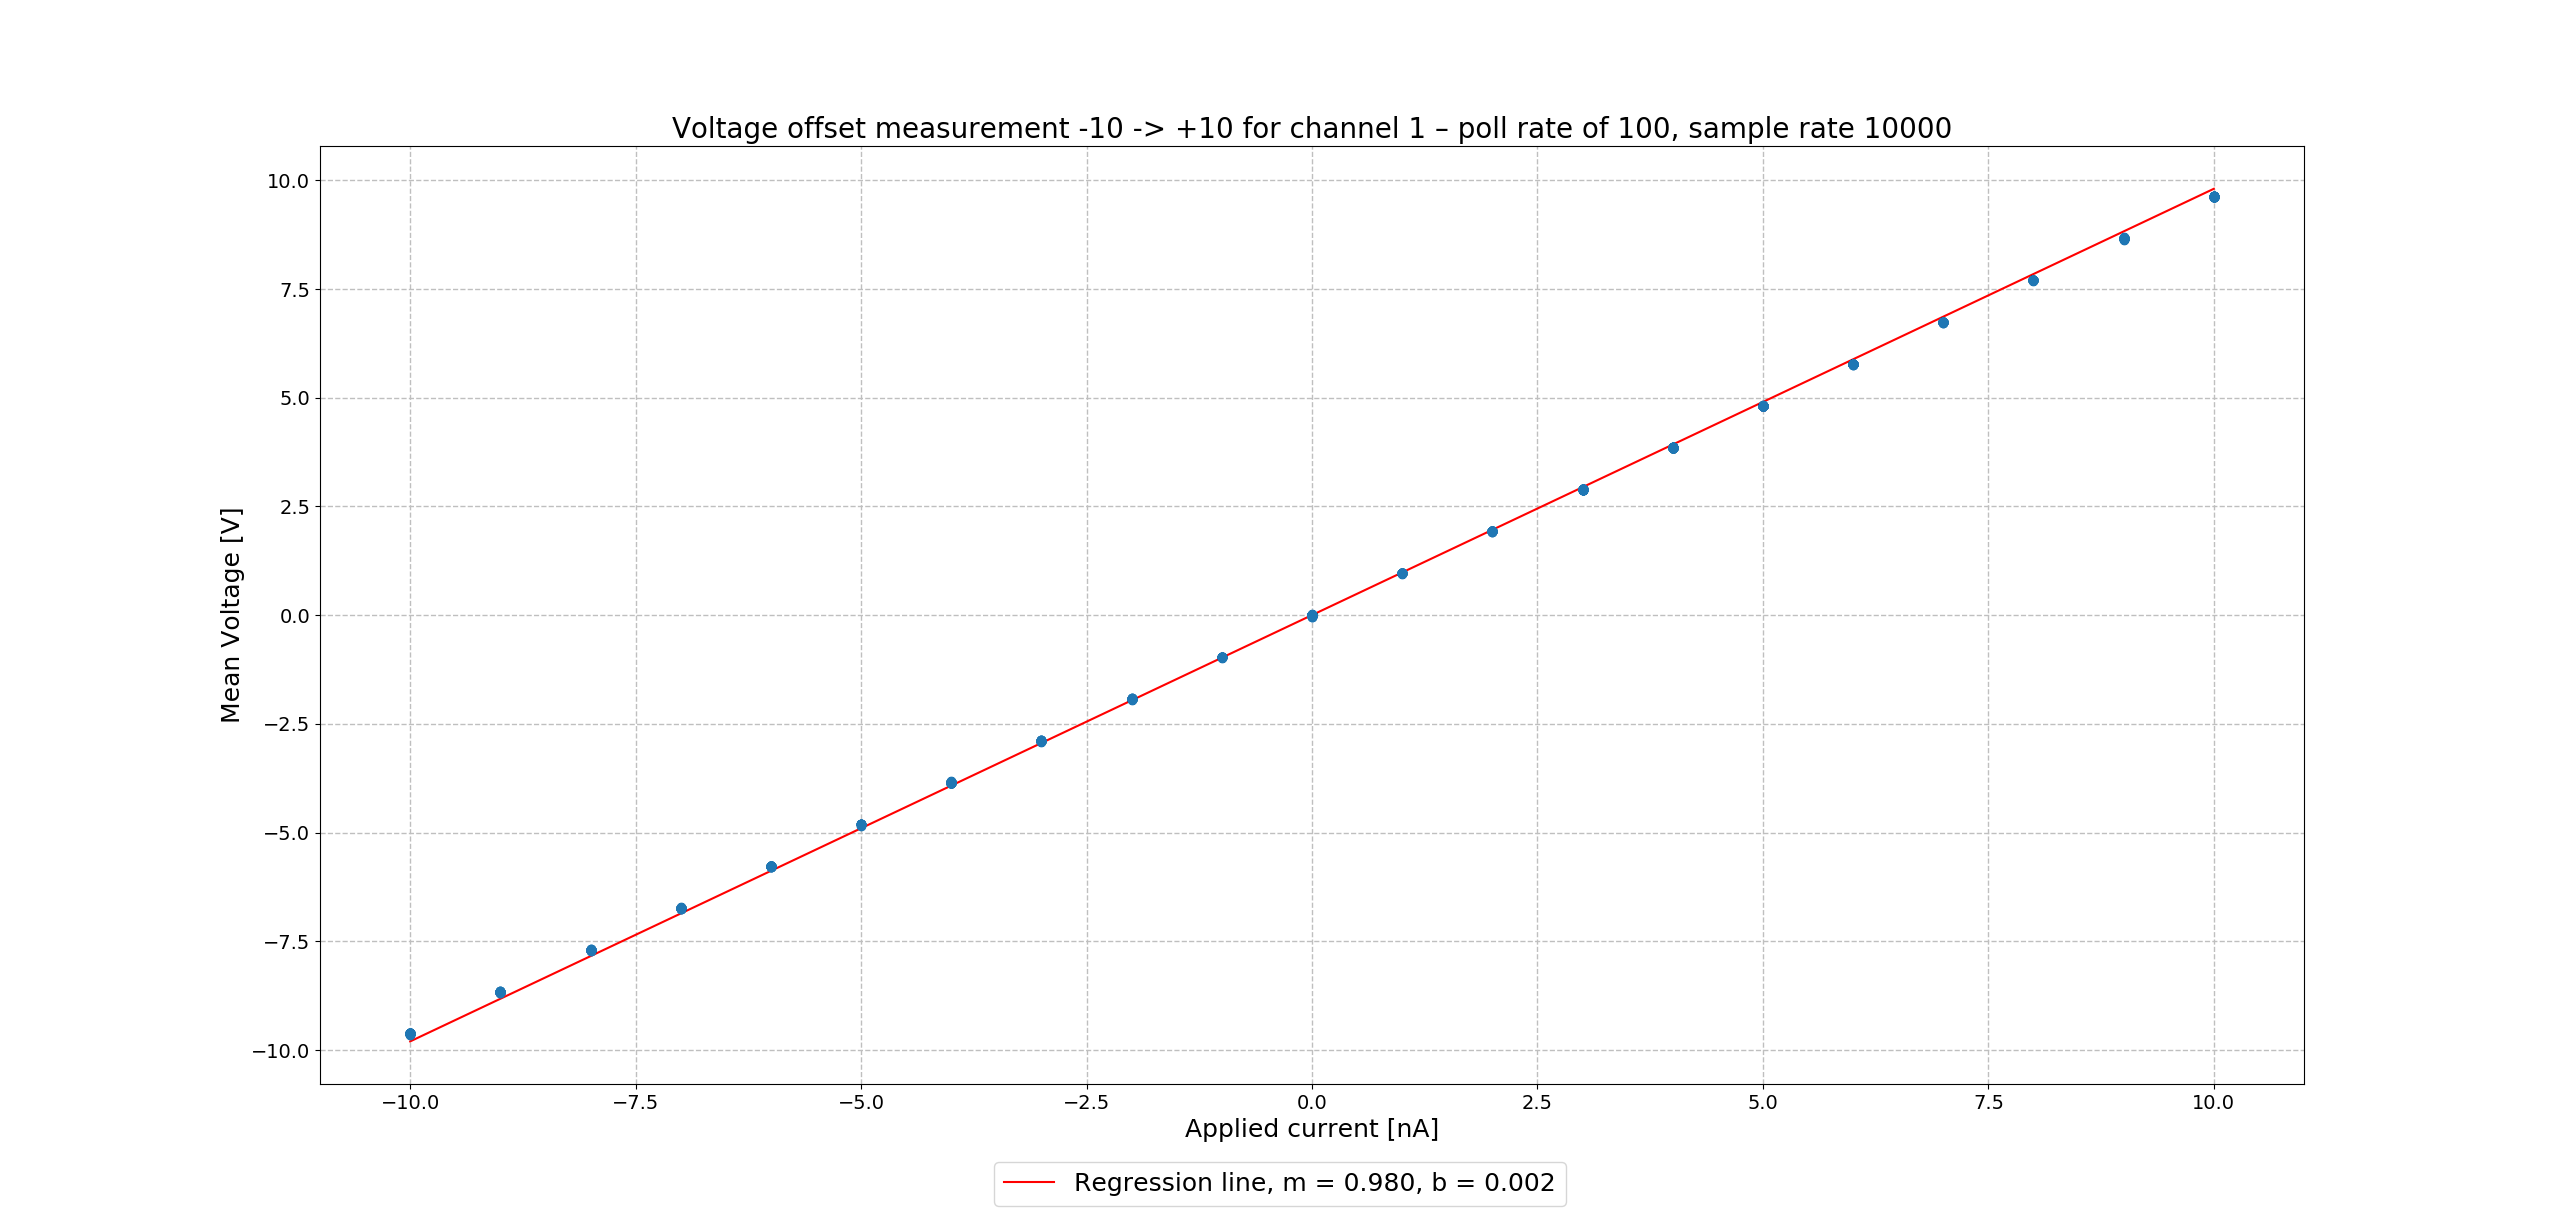
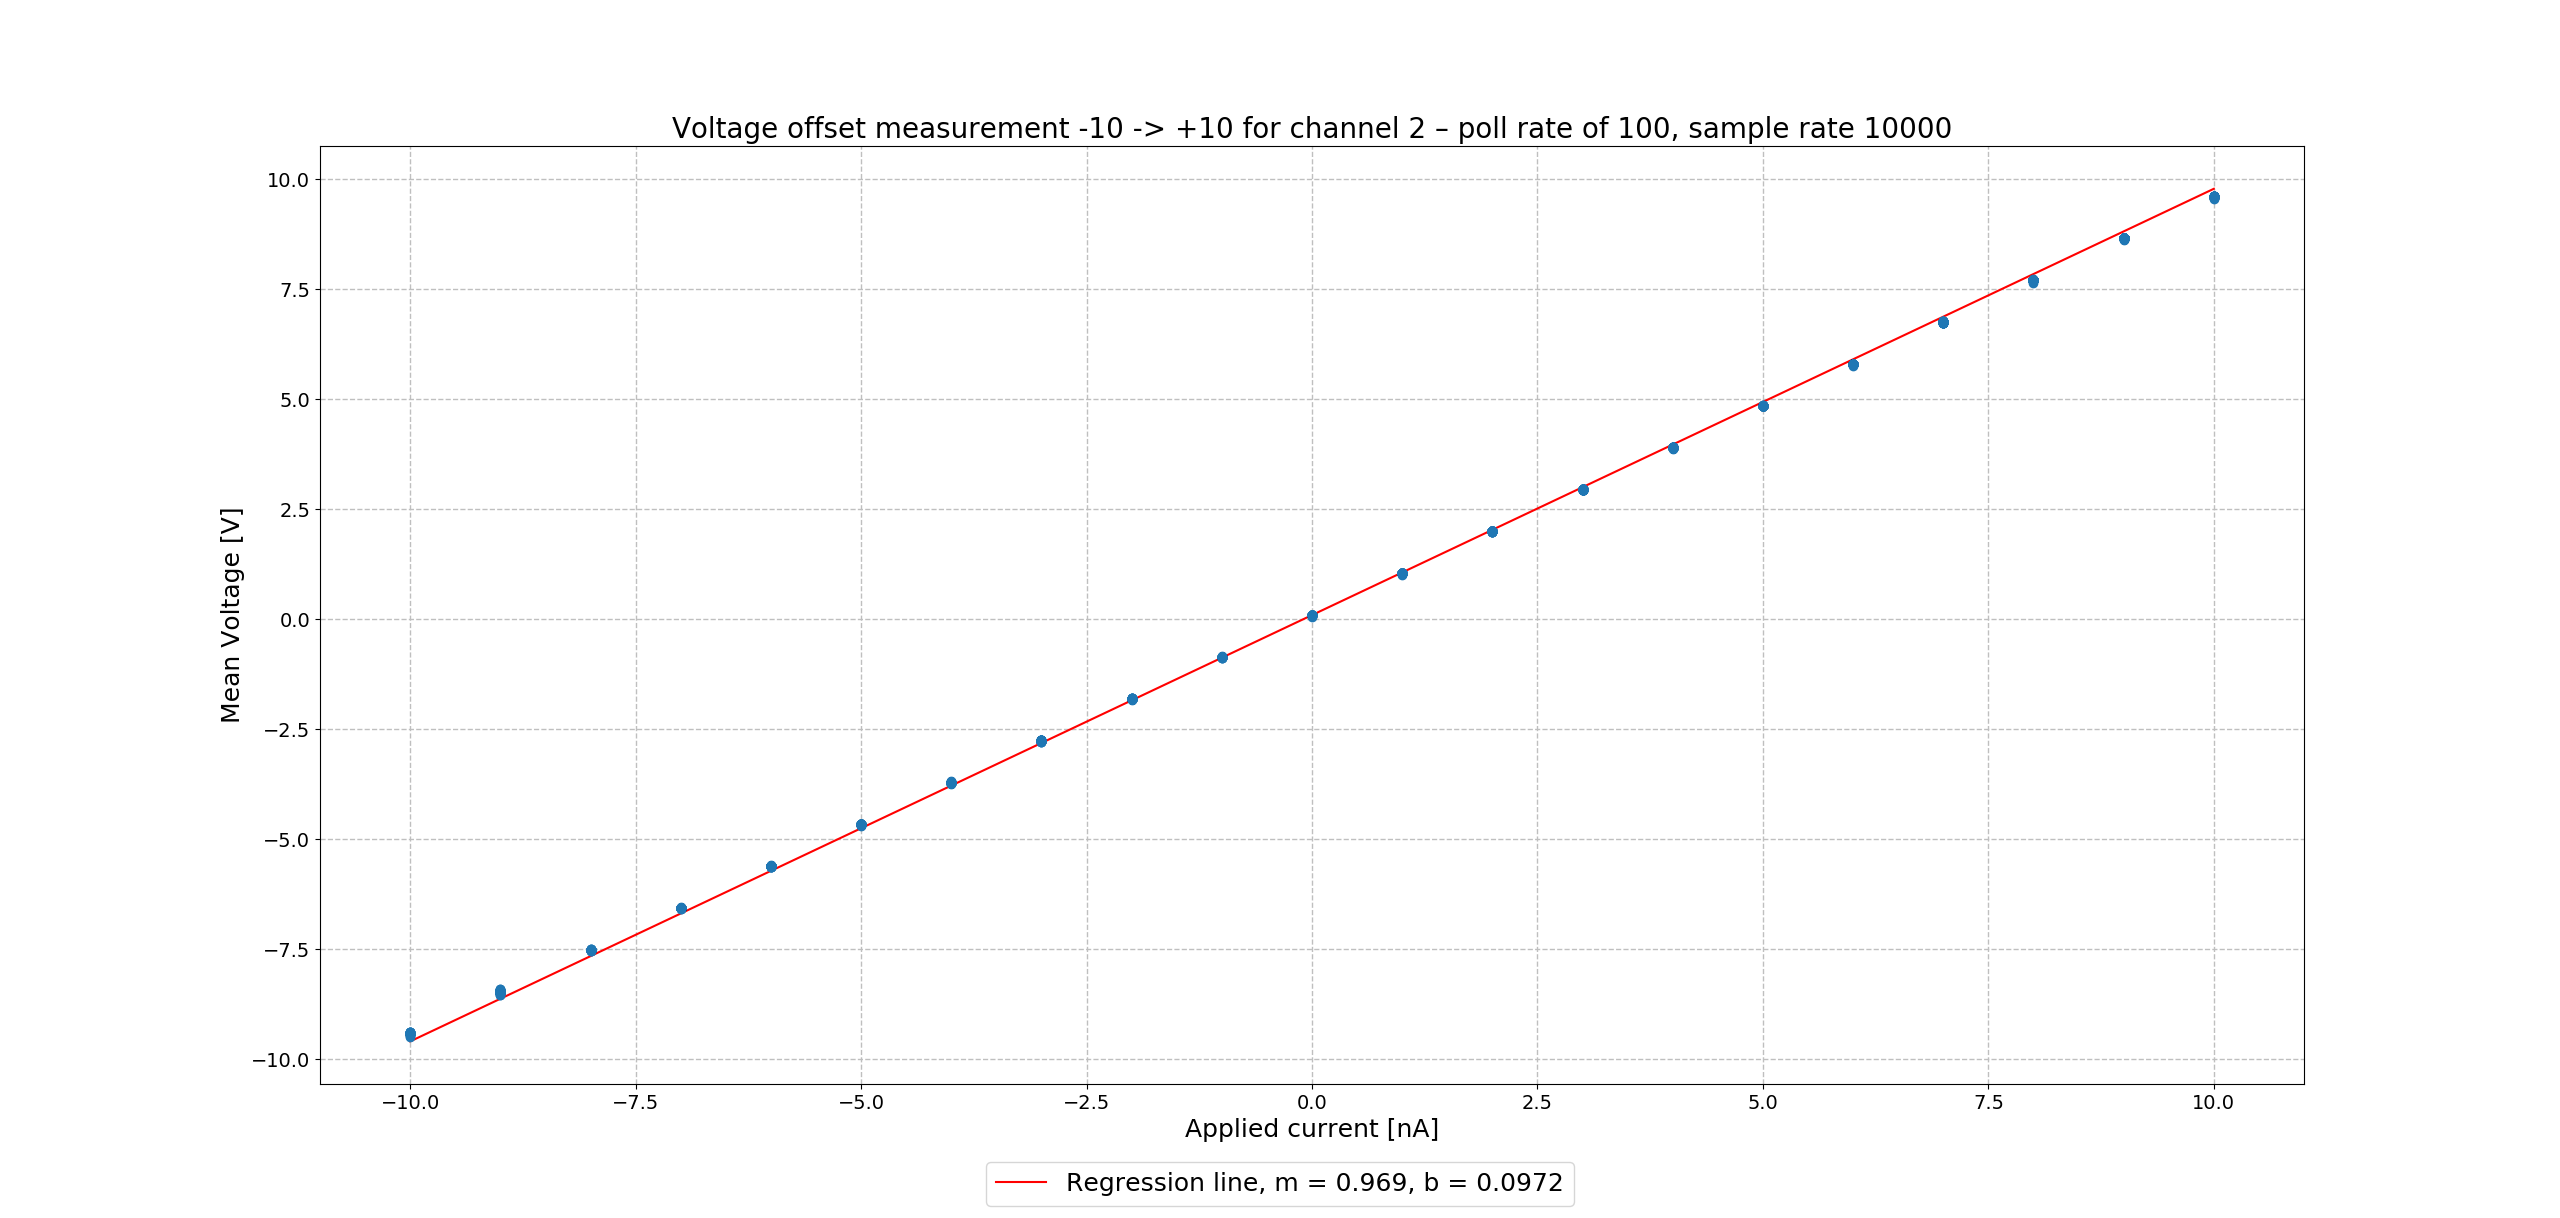
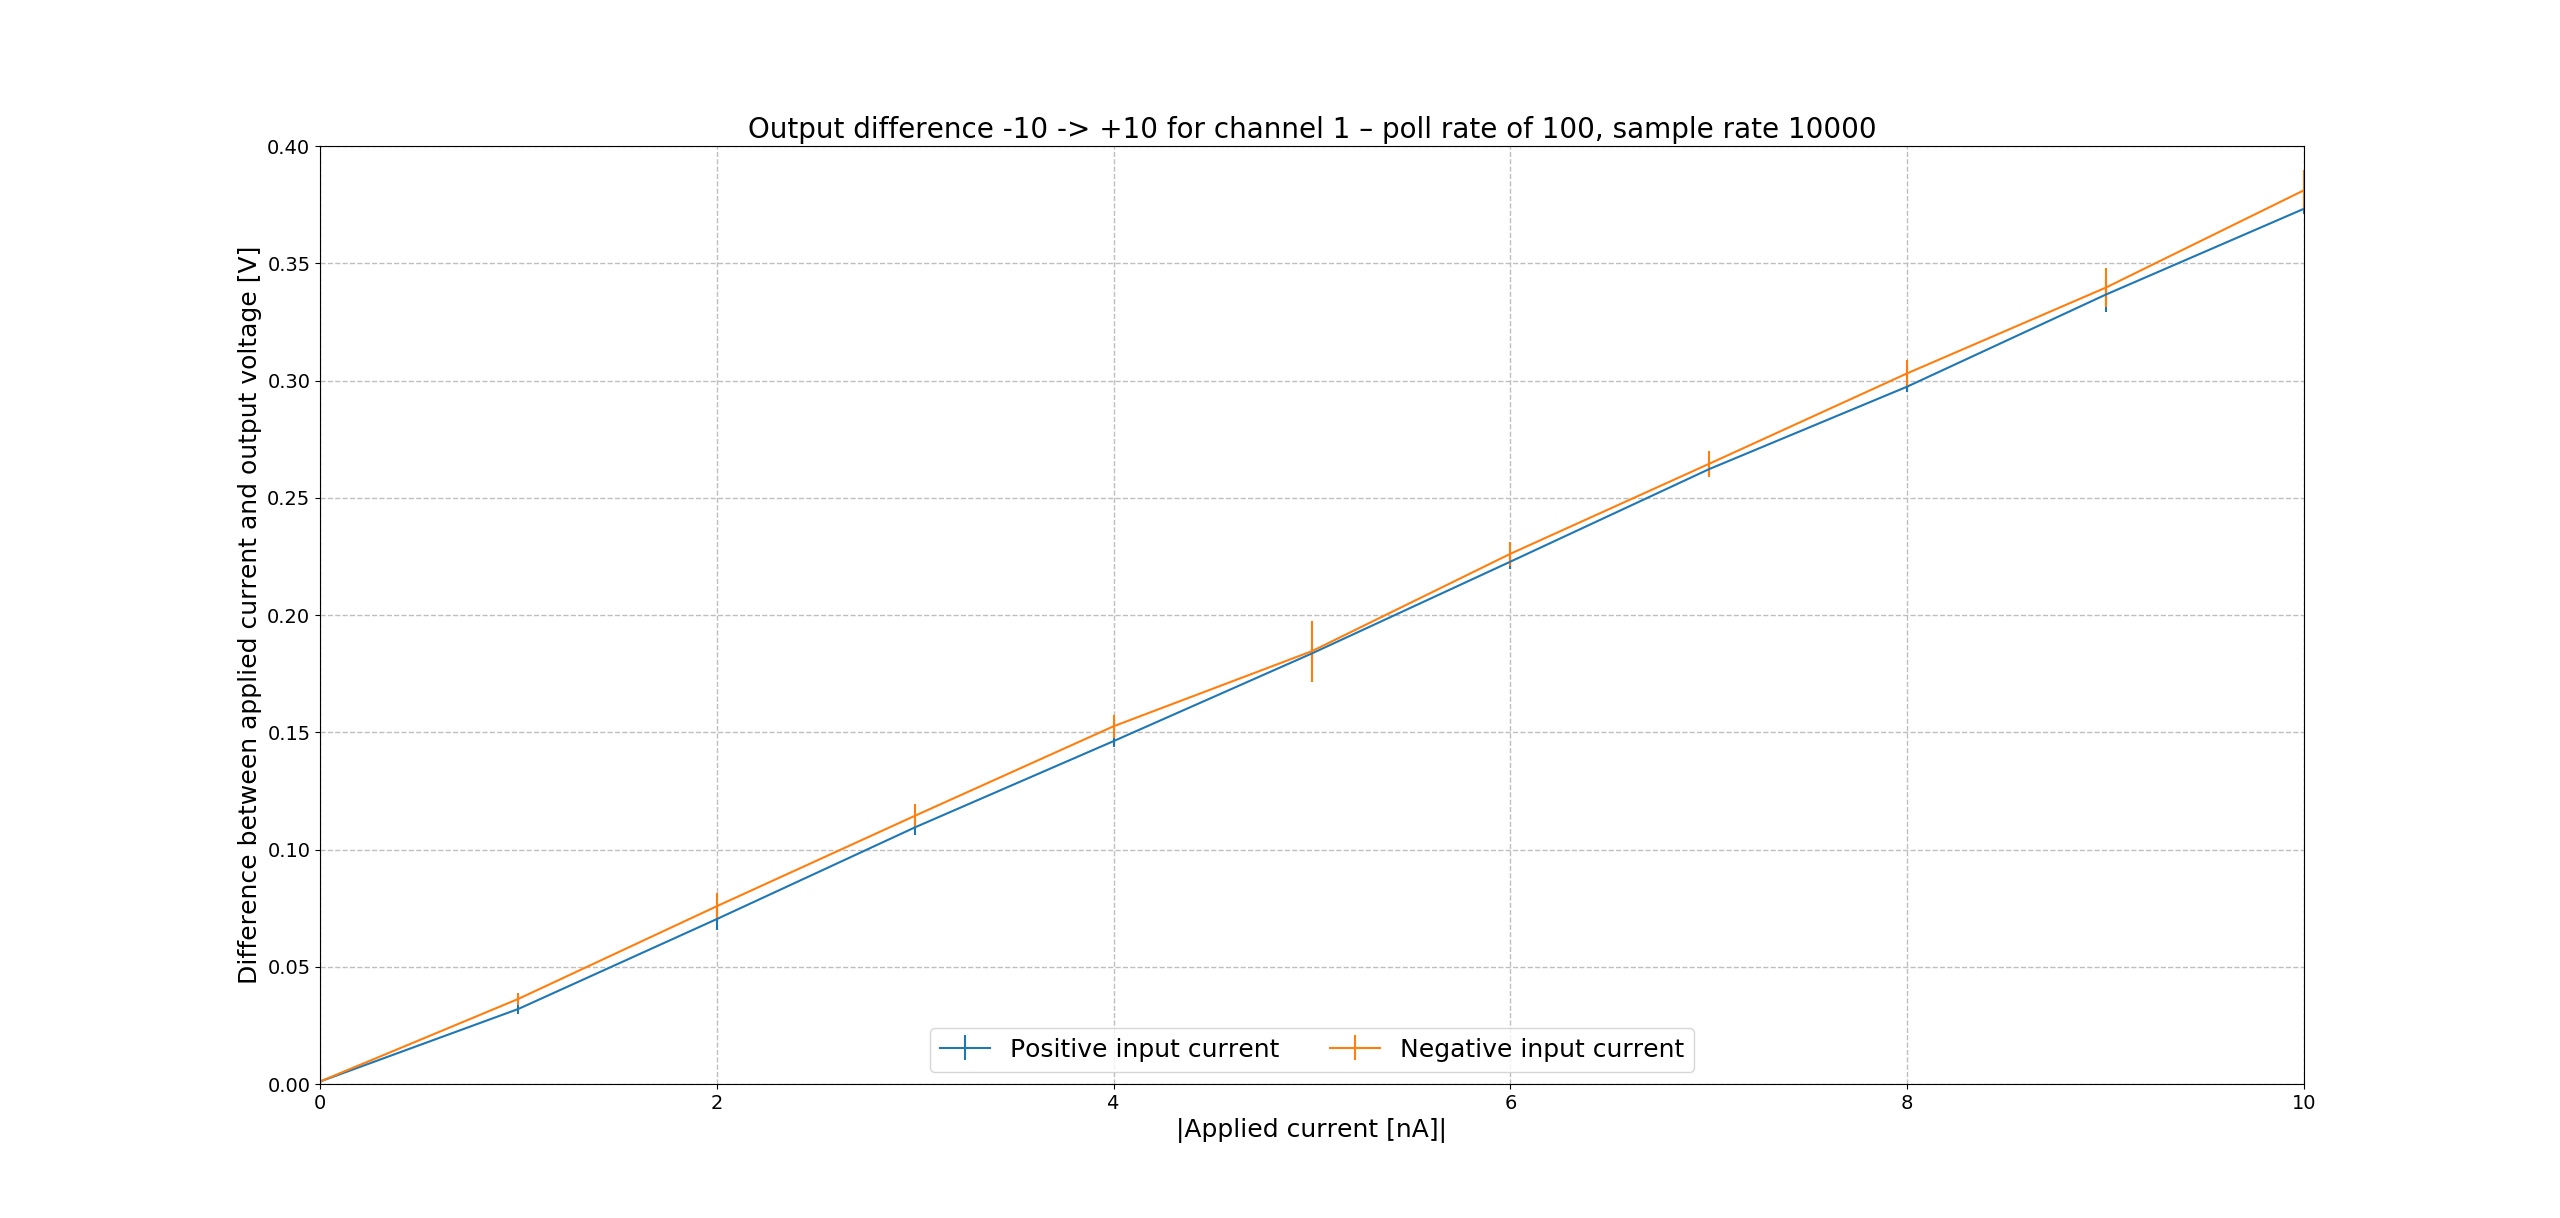
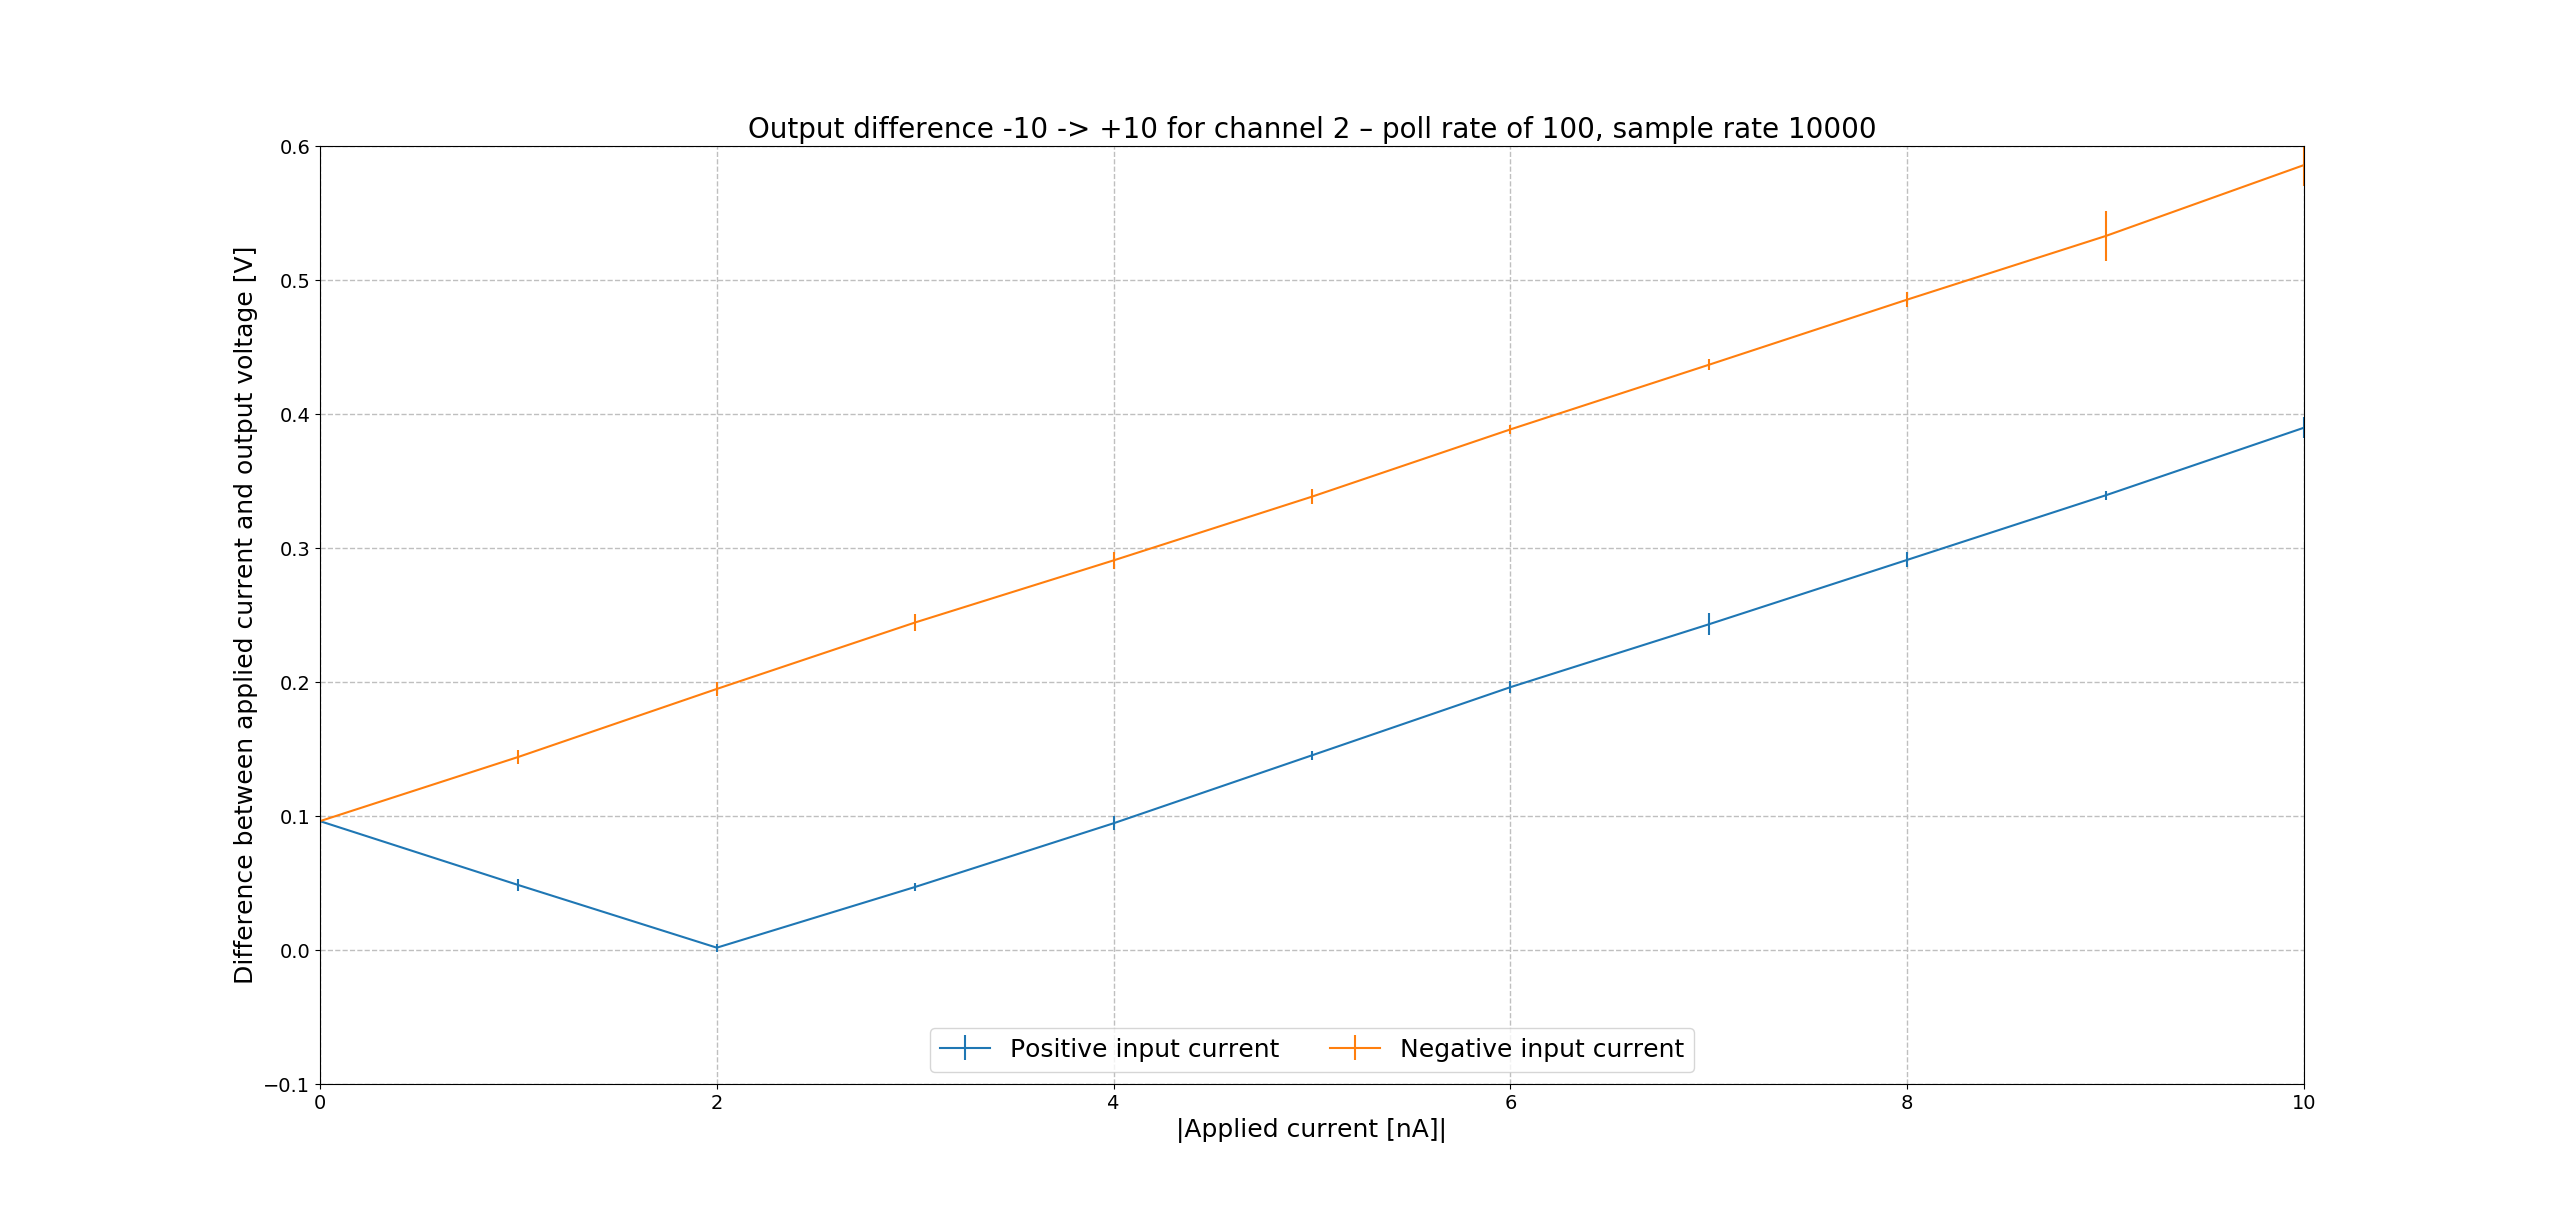
This measurement was to characterise the voltage offset for channel 1 and 2. The sampling rate was set to 10000 and poll rate 100. The applied current was changed from -10 nA to +10 nA in steps of 1 nA. The first two figures below so the voltage vs applied current. In order to see the difference more clearly, the absolute difference between the applied current and the measured voltage is taken and plotted against the applied current.
Error checking
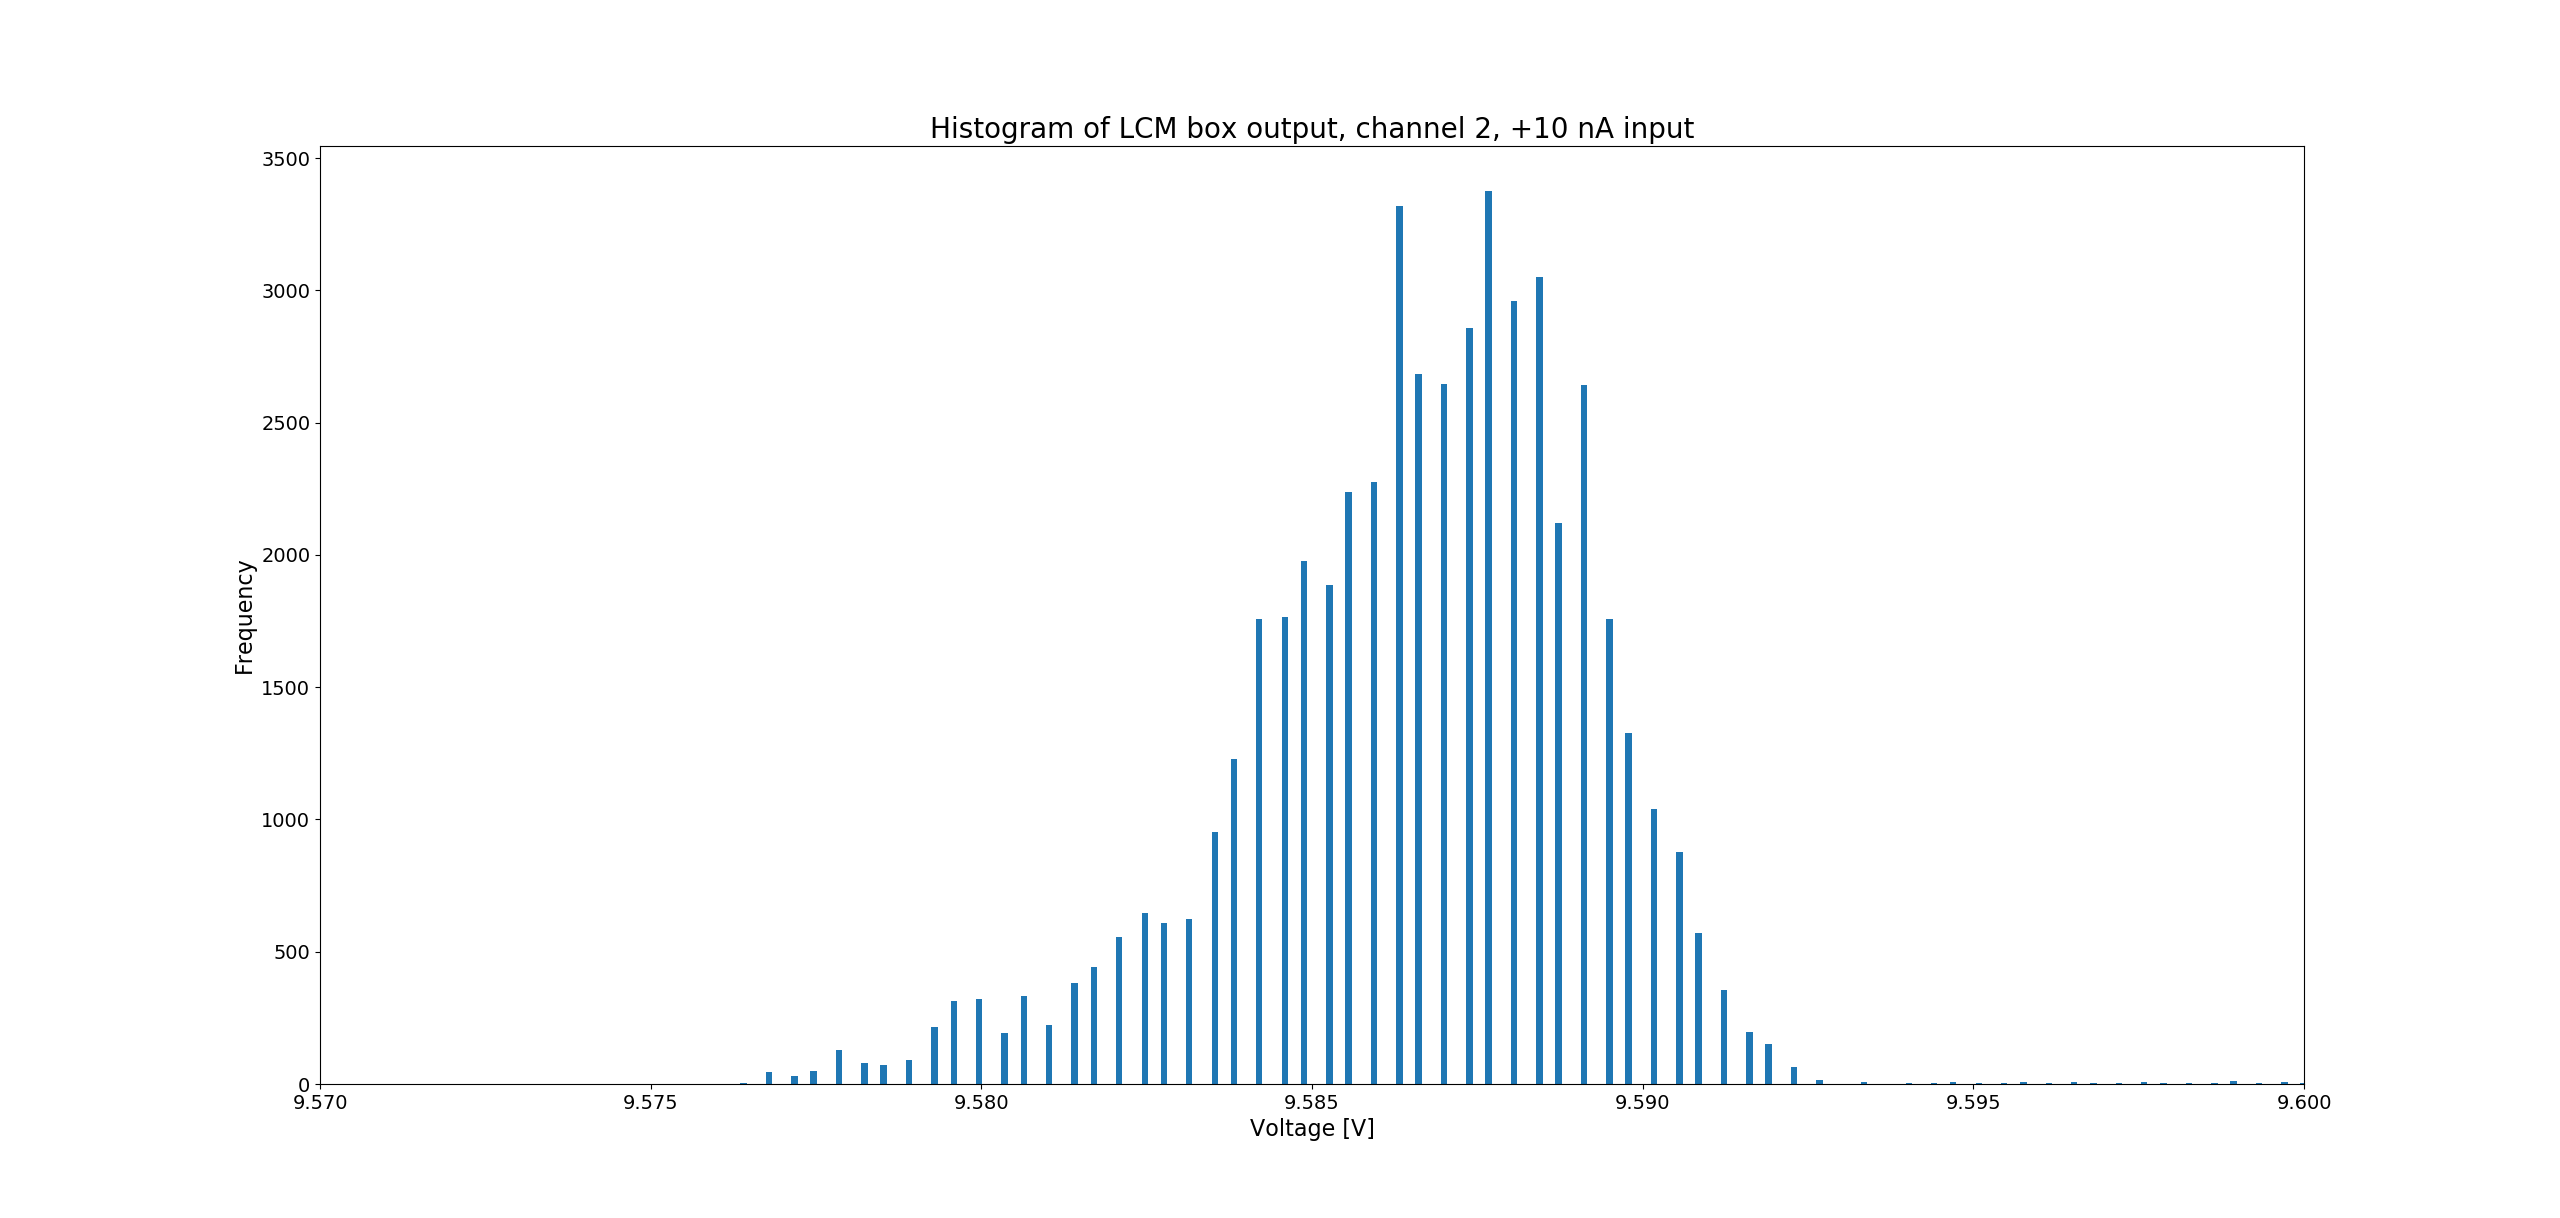
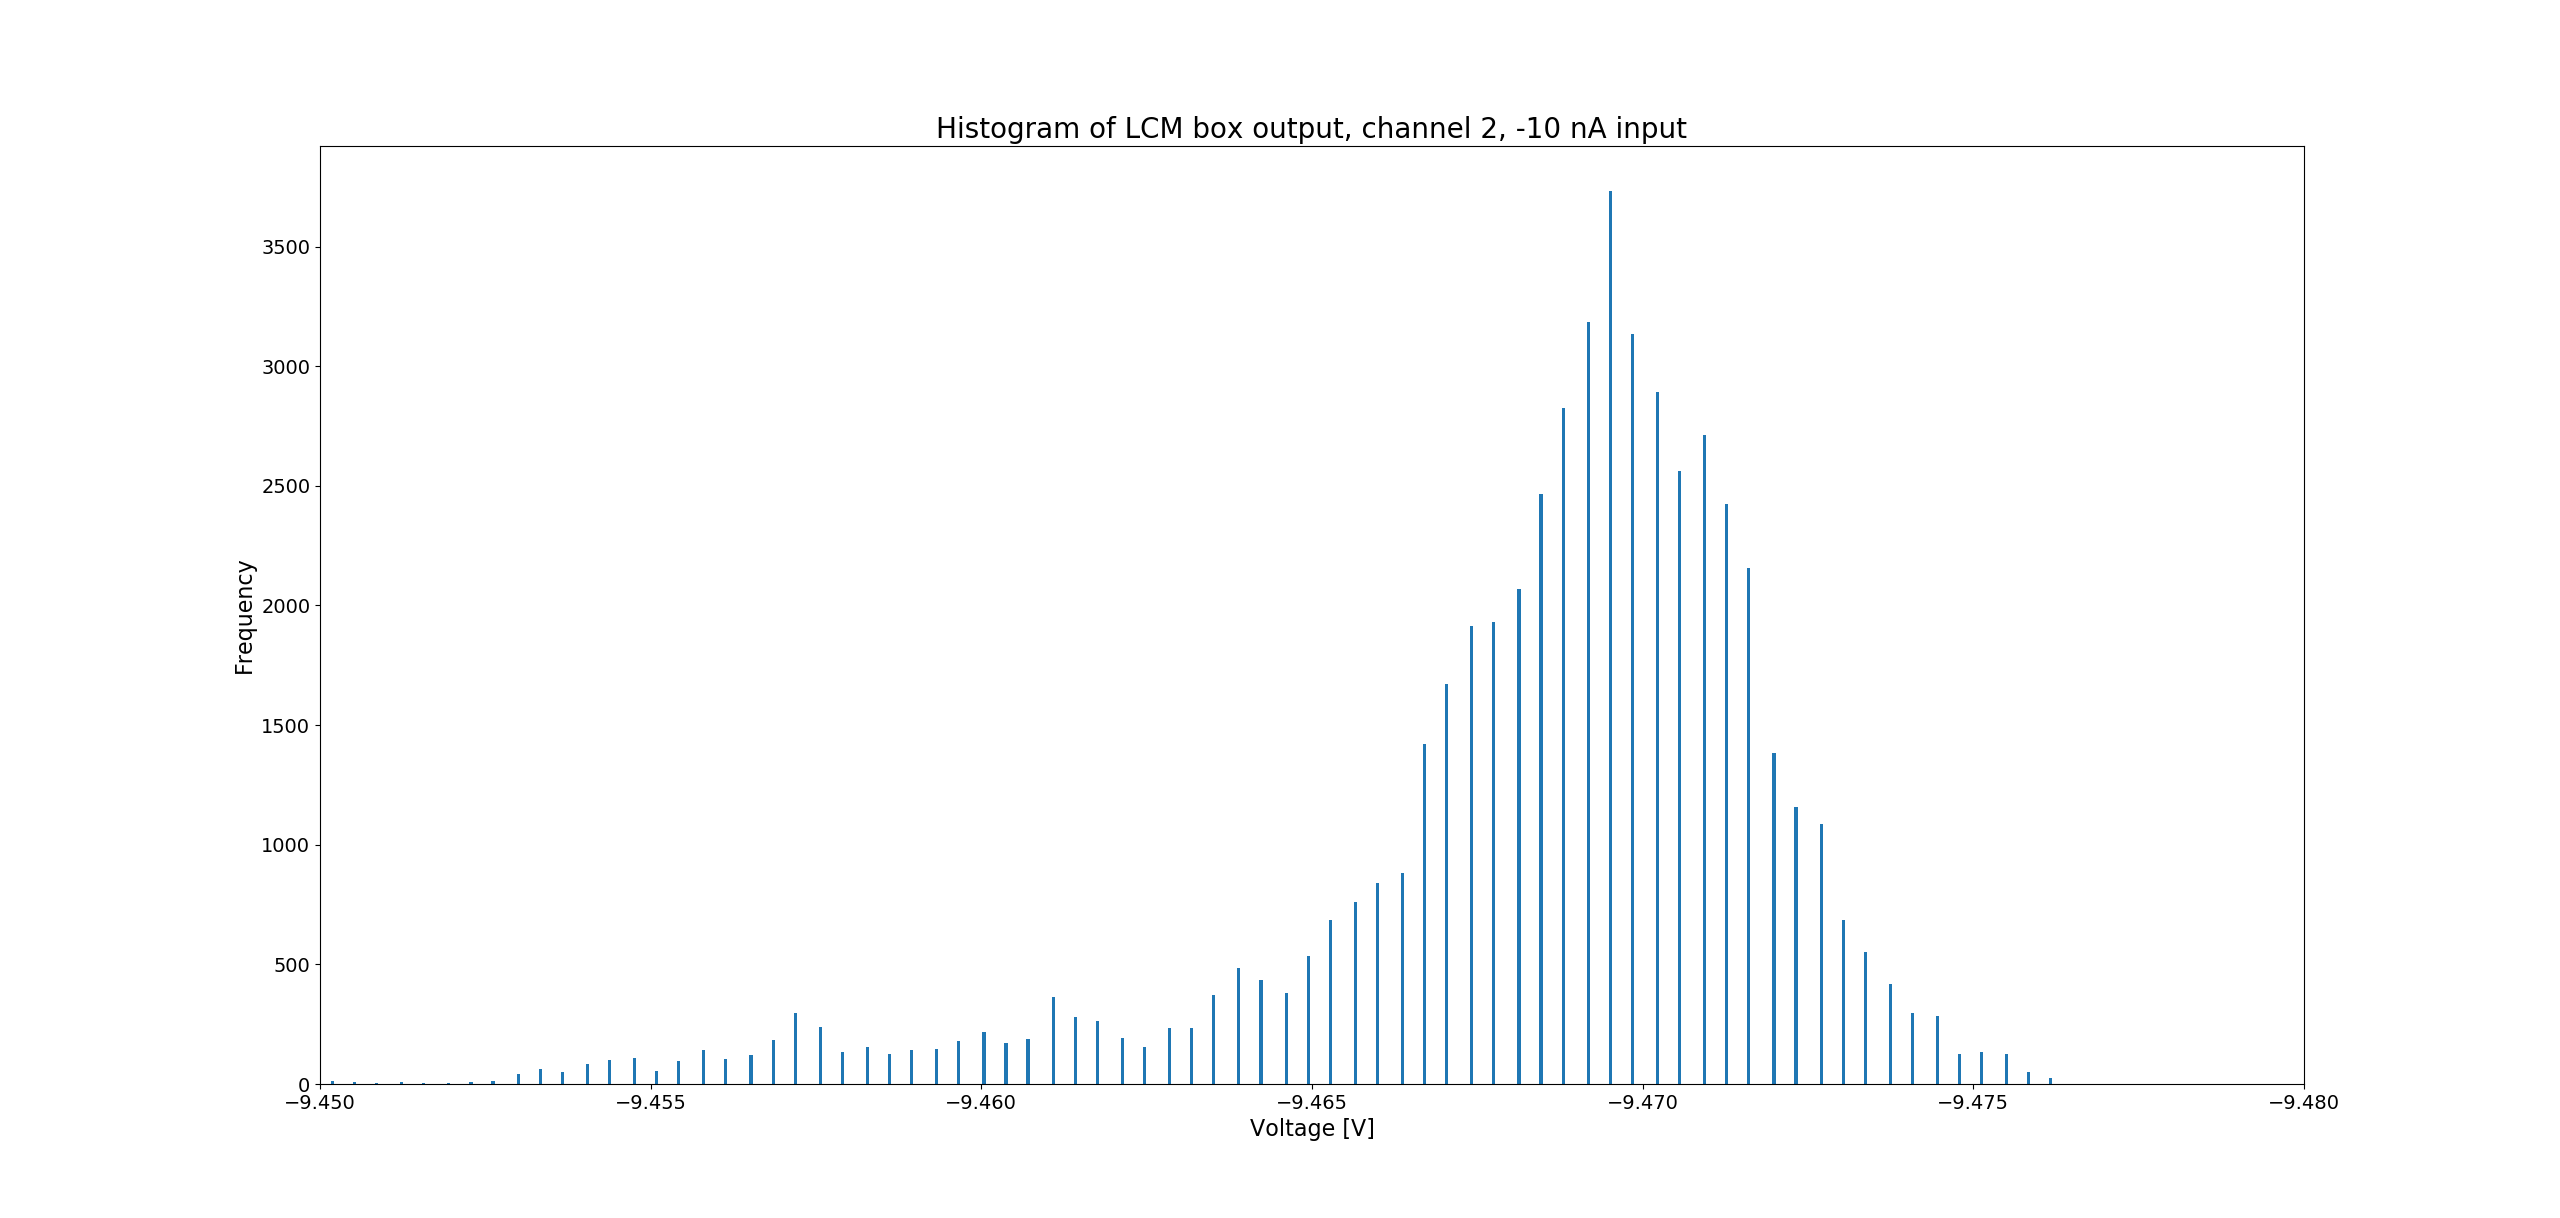
In the previous plots the error bars where determined by using the standard deviation. To check this was valid, the data was checked to see how Gaussian it was. The following are histograms of the same data set used for the crosstalk measurements, binning is set to 10000 between the two ranges on the x axis.
The plots show something that is Gaussian. There is a tail on the lower side of the curve, this is most likely due to the ramping up to the set current in which it then stabilises, which is present in the previous results.
Summary
- The measurements above indicate that there is no crosstalk present between channel 1 and 2.
- Noise on channel 1 shows a peak at approx. 33 Hz and 40 Hz. While channel two only has the 33 Hz signal. The 50 Ohm terminations also see these signals, however, the level is different between the two channels. However, these signals are <1.5 mV which translates to 1.5 pA, below the sensitivity of the Femto LCA-S devices.
- The stability measurements is quite flat. This can be considered stable to <104 seconds. However, the stability gets worse for higher currents applied. This measurement cannot separate the stability of the Keysight power supply, therefore, this could be included in these results.
- The voltage offset shows there is a linearly increasing difference between the applied voltage and what is actually read out. The cause of this could be due to leakage current across the diodes which would result in a drop in the current that goes through the Femto LCA-S device. This would need to be corrected for in the raw data for an real measurement. Channel 1 shows that both polarities gives the same behaviour, however, channel 2 as an additional offset in the negative polarity. The reason for this is unknown.
- It is shown valid to take the standard deviation of the data to get the error bars.
